A new AI-driven scientific framework has
mapped marine biodiversity across the Scandinavian sector of the Greater North
Sea and identified major gaps between where marine life is concentrated and
where protection currently exists.
The
results are based on more than 100,000 species records combined with
oceanographic data from the EU Copernicus Marine Service. Using machine-learning
and neural-network modelling, the platform identifies biodiversity patterns, key
environmental drivers, and likely future shifts across the North
Sea-Skagerrak-Kattegat region.
The study
covers 43 marine vertebrate species, including fish, seabirds, and marine
mammals, as well as broader richness models for total, taxonomic, and functional
biodiversity.
One of the
clearest findings is that marine fronts and currents strongly shape species
richness. In several areas, the richest biodiversity follows dynamic
oceanographic features such as the Norwegian Trench and the Swedish west coast.
The models also identify clear temperature and salinity thresholds linked to
richness and assemblage structure.
Just as
importantly, major biodiversity hotspots remain weakly protected or entirely
outside current MPAs. In some places, high-richness areas and strict protection
overlap only partly, suggesting that existing networks still fall short of an
ecosystem-based design.
This is
especially relevant because EU and regional frameworks, including the Marine
Strategy Framework Directive, OSPAR, and HELCOM, all call for coherent marine
protection networks that reflect ecological realities rather than administrative
boundaries.
The work
also points to climate-related change. The models identify a clear temperature
optimum for peak richness, and richness is shifting toward deeper waters. That
pattern is consistent with climate-driven redistribution toward preferred
thermal habitat and may reduce the effectiveness of some present-day protected
areas if species continue to move.
The
framework can also be combined with fisheries data. Early overlays with trawling
intensity suggest that some strictly protected areas in Denmark may have been
placed where fishing conflict is relatively low rather than where biodiversity
value is highest. That does not diminish their legal status, but it does
underline the need for more transparent, data-driven spatial planning.
Overall Species Richness and a key driver
The species
richness assessment is robust and was produced using two AI-assisted approaches:
one based on ensemble species models and the other on hotspot modelling. Both
approaches produce the same overall spatial pattern, as shown in Figure 1.
Both
predictions are based on a very large number of species records, drawn
predominantly from ship surveys conducted between 1993 and 2023. As a result,
the dataset has a historical bias, and species distributions have changed over
time. More detailed results on temporal change will be presented later.
Marine fronts
have been a central research focus throughout this work and a key part of the
successful species predictions and our understanding of the ecological processes
shaping the region. The main marine front is overlaid in Figure 1, and further
details will follow.
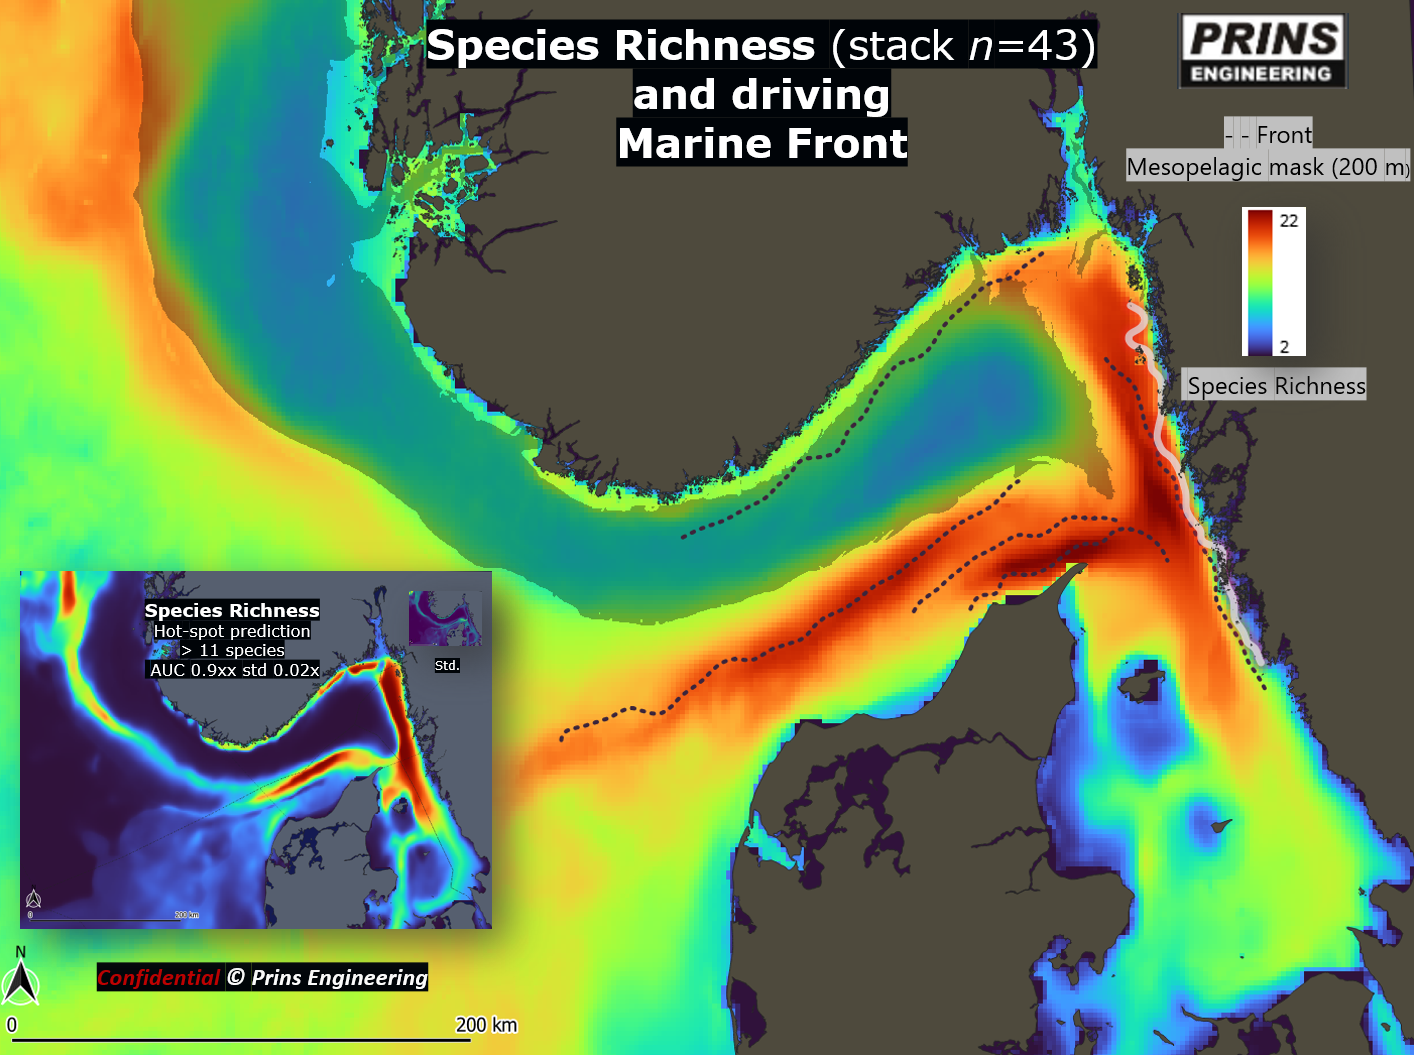
Figure 1. Predicted species
richness from two modelling approaches, showing broadly similar spatial
patterns. Marine fronts align closely with areas of elevated richness.
Biodiversity, MPAs and fishery intensity
Major
biodiversity hotspots remain weakly protected or entirely outside current MPAs.
In some places, high-richness areas and strict protection overlap only partly,
suggesting that existing networks still fall short of an ecosystem-based design,
as shown in Figure 2.
This is
especially relevant because EU and regional frameworks, including the Marine
Strategy Framework Directive, OSPAR, and HELCOM, all call for coherent marine
protection networks that reflect ecological realities rather than administrative
boundaries
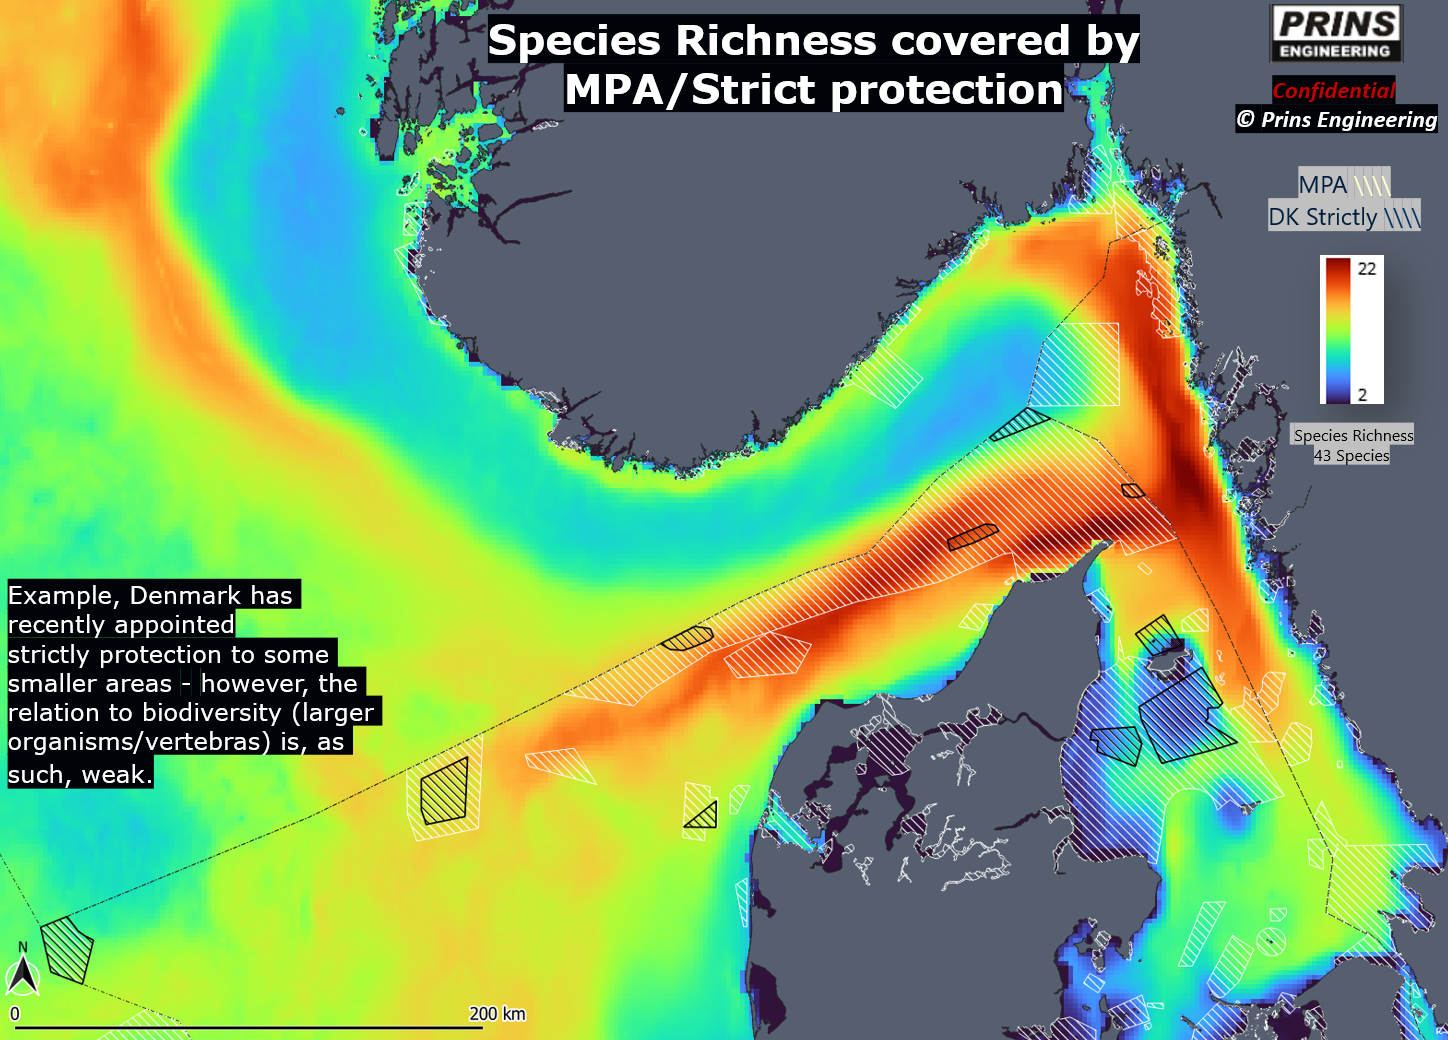
Figure 2. Predicted species richness (43
species) with
existing MPAs overlaid. Danish strictly protected areas are shown with black
hatching.
When the
biodiversity assessment is compared with trawling intensity, it suggests that
some strictly protected areas in Denmark may have been placed where fishing
conflict is relatively low rather than where biodiversity value is highest. That
does not diminish their legal status, but it underlines the need for more
transparent, data-driven spatial planning.
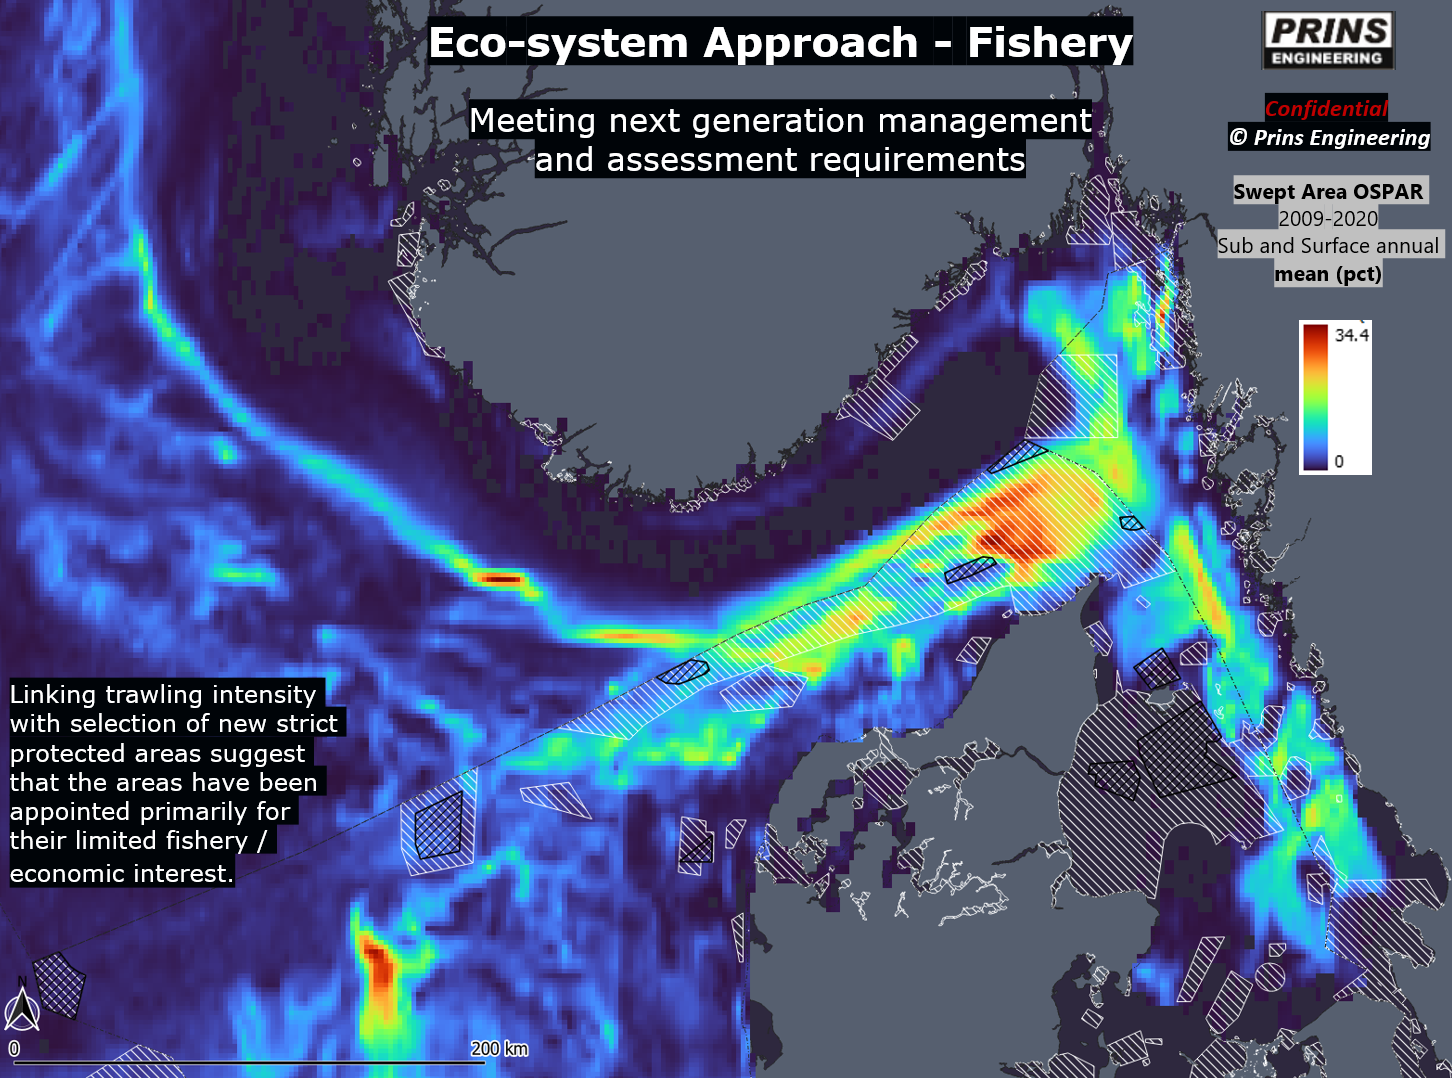
Figure 3. Average annual trawling swept-area
ratio (OSPAR, 2009-2020) overlaid with MPAs. Several Danish strictly protected
areas appear to avoid high trawling intensity rather than coincide with
biodiversity hotspots.
New Horizonts for
SDMs
The AI-assisted species
distribution models add a new dimension to understanding marine habitats. They
not only show where species are likely to occur, but also help identify the
environmental drivers behind those patterns.
AI makes a real difference, but it
does not remove the need for careful filtering and quality assurance. Bird data,
for example, are notoriously challenging because they often reflect
opportunistic behaviour and observation bias. One example is the Common Gull,
where one model shows broader occurrence and another highlights a more natural
habitat pattern that is less influenced by human activity (Figure 4).
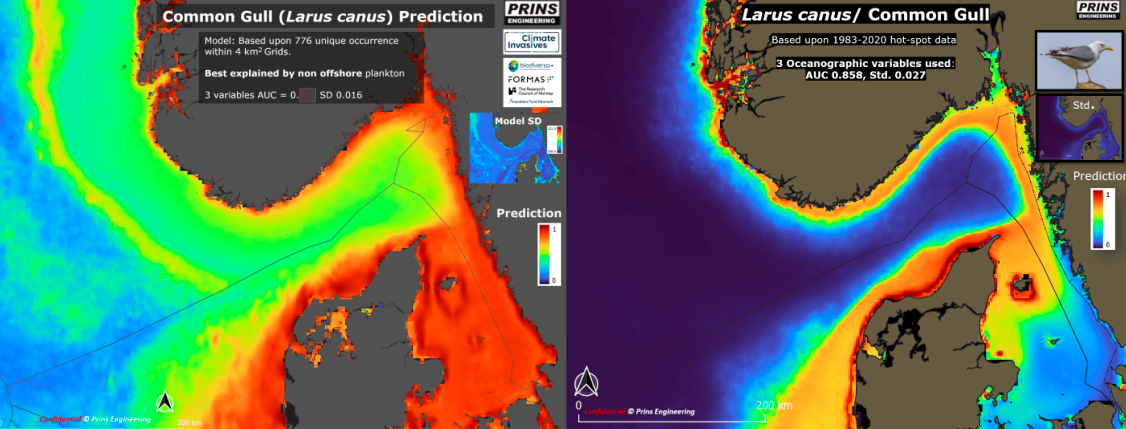 Figure 4.Two
models of common gull developed for showing core native habitats (right) versus
factual habitat, suggesting anthropogenic activity as a strong supporting
factor.
Figure 4.Two
models of common gull developed for showing core native habitats (right) versus
factual habitat, suggesting anthropogenic activity as a strong supporting
factor.
Another example is orca, which is
increasingly being observed in Skagerrak, often seasonally and in areas with
high densities of pelagic fish such as garfish. The orca model (figure 5) is
particularly strong and is driven by a single front-related variable. It also
strongly suggests that these orcas are fish eaters.
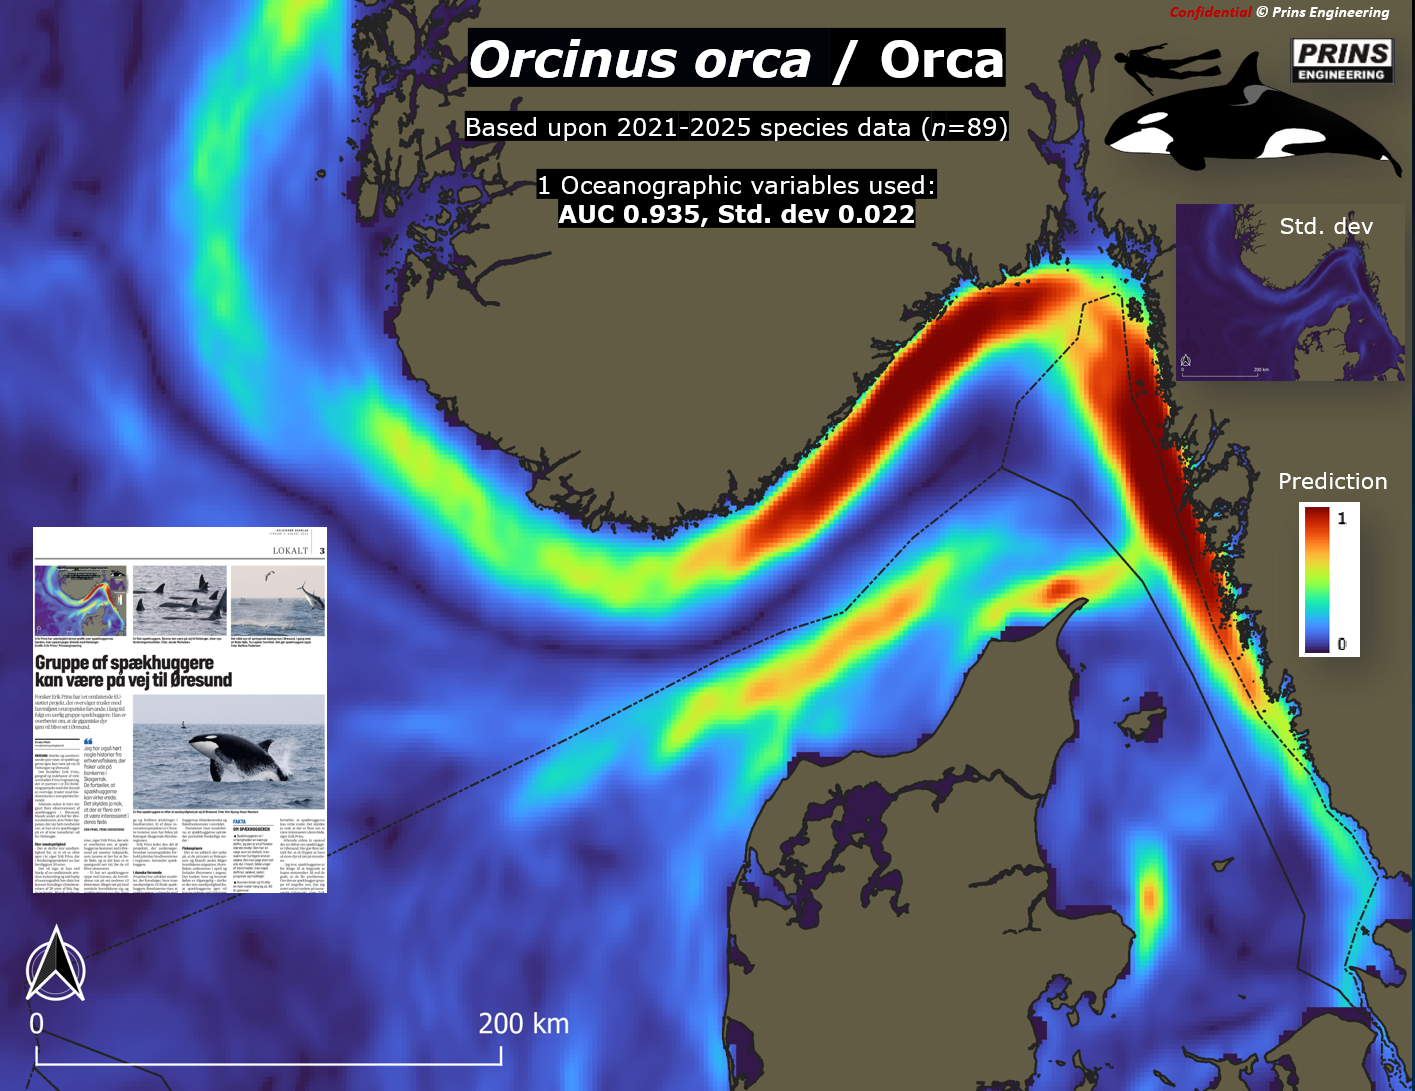
Figure 5. Orca occurrence predicted from one
derived oceanographic variable, the strongest predictor in the model.
The species models include several sensitive and
economically important fish species, such as lumpfish, eel, and lamprey, as well
as other threatened species. The framework also suggests that substantial
species turnover is underway, as revealed by comparing predictions based on
historical species richness data with those based on recent data (Figure 6).
This suggests that some elasmobranch species are likely to occur more frequently
in the region, while several bird species associated with protected EU habitats
may face increasing pressure.
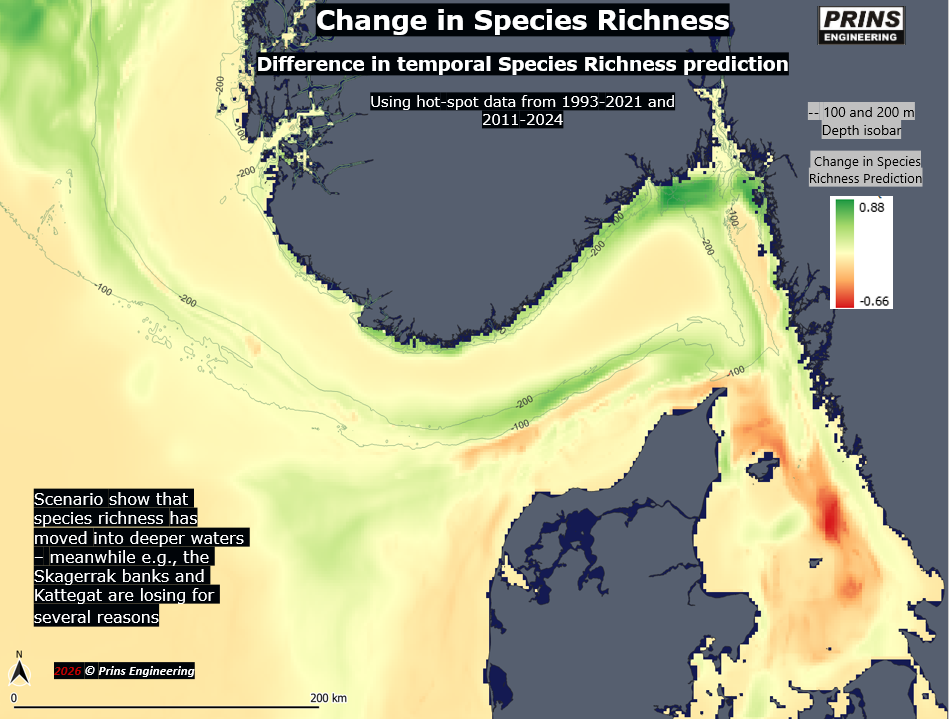
Figure 6.
Change in predicted species richness based on species records dating back to
1993 compared with predictions based only on records from 2011–2024 for the same
species.
I will add further details in the future,
including information on AI-based processing of oceanographic data. In this
context, satellite observations can provide advantages over numerical
oceanographic models, as they offer direct measurements and may improve
predictive performance for certain applications. The oceanographic variables
used in this work have been validated across multiple datasets and modelling
frameworks and, in some cases, outperform existing regional oceanographic
models.
Future climate projections have been produced
according to current state-of-the-art practices, including bias correction and
delta-change forcing based on an ensemble of CMIP6 climate models for the
relevant variables. Consistency in the oceanographic variables is important for
predicting shifts in the distribution of functional species groups. As indicated
above, evidence already points towards climate-driven species turnover, a topic
that I will explore in greater detail in future work.
Finally, my core research topic is marine fronts (see also [link]), which
currently appear to be among the strongest explanatory variables for predicting
biological productivity and species richness in the Skagerrak. There are,
however, indications that the characteristics and influence of these fronts are
changing and will continue to change under future climate conditions. This may
have important implications for the productivity and diversity of certain
species groups
The work has been
initiated in connection with an EU Biodiversa+ project (2023-2026), where Prins
Engineering leads a work package on marine fronts and biodiversity. The work has
been supported by Innovation Fund Denmark.



Client: EU
Funding: InnovationFund (DK), EU and Prins (>25%)
privacy2026@prins engineering.com