oil
block 5A
- MASSIVE DISPLACEMENT IN TRADITIOnal land use
- The
oil
fields of Sudan / Southern Sudan -
Summary
of Prins peer reviewed research results - covering latest advances and monitoring system
Background and Introduction
In 2006, Prins was commissioned by the European Coalition on Oil in Sudan (ECOS)
to map land-use changes in Oil Block 5A, focusing on 1999–2003. Previously, he
conducted similar analyses in
Blocks 3 and 7, always using Landsat imagery—a continuous, multi
spectral archive dating back to the mid 1980s. Landsat’s seven spectral bands
(visible and infrared) reveal crop types, soil moisture, biomass, rangeland
condition, and more (for a lay overview,
see NASA’s
Landsat summary). Over 25 years of work in Sudan and South Sudan—including
uncovering the Darfur crisis—has demonstrated Landsat’s power to
detect large scale human impacts with local precision.
Evolution of the 5A Study
·
2006–2010:
Initial ECOS report used unsupervised (ISODATA) classification of early
dry‑season Landsat images to map traditional agro‑pastoral footprints. Change
detection matched ground reports of village attacks and mass displacement.
· 2013:
Invited keynote at Swedish Space Days introduced verification using Very High
Resolution (VHR) imagery from Google Earth (QuickBird‑2).
· 2013–2015:
New humanitarian crisis generated a wealth of VHR data, enabling systematic
validation and refinement of Landsat methods.
· 2017:
Publication in the
International Journal of Remote Sensing
documented a robust, peer‑reviewed monitoring system.
Below is a concise overview of how the traditional agro pastoral land use
informs our satellite derived change patterns. The detailed text is intended for
specialists or engaged laypersons; casual readers can focus on the figures and
their captions.
Traditional Agro Pastoral Land Use
1. Seasonal Floodplain Environment
o
Located in a flat, flood prone basin crossed by the White Nile and Sudd
wetlands.
o
Populated by Nuer and Dinka agro pastoralists, where cattle outnumber people.
2. Homestead & Cropping Cycle
o
Settlements (mud hut “tukuls”) sit on natural levees just above floodwaters.
o
Wet season (May–Nov): People and cattle concentrate on homesteads; crops grow
and are harvested by early dry
season.
o
Dry season (Nov–May): Cattle range up to 50 km/day seeking fresh grasses;
homestead fields lie fallow.
3. Satellite Footprint
o
Post harvest, bare soil reflectance around homesteads creates a bright
“footprint” in early dry season imagery.
o
Absence of that bright signature year to year indicates displacement of people
and cattle.
Figures
Fig 1:
Landsat 27 Nov 1999 (Bands 3,2,1) showing natural
colors: lush vegetation (green) vs. farming footprints (whitish). Overlay
of towns, watercourses (blue), oil block border, roads, seismic grids (yellow).
Fig 2–5: On ground photos of tukuls,
cattle (abigar), and grazing impacts demonstrating how degradation appears in
multispectral data.
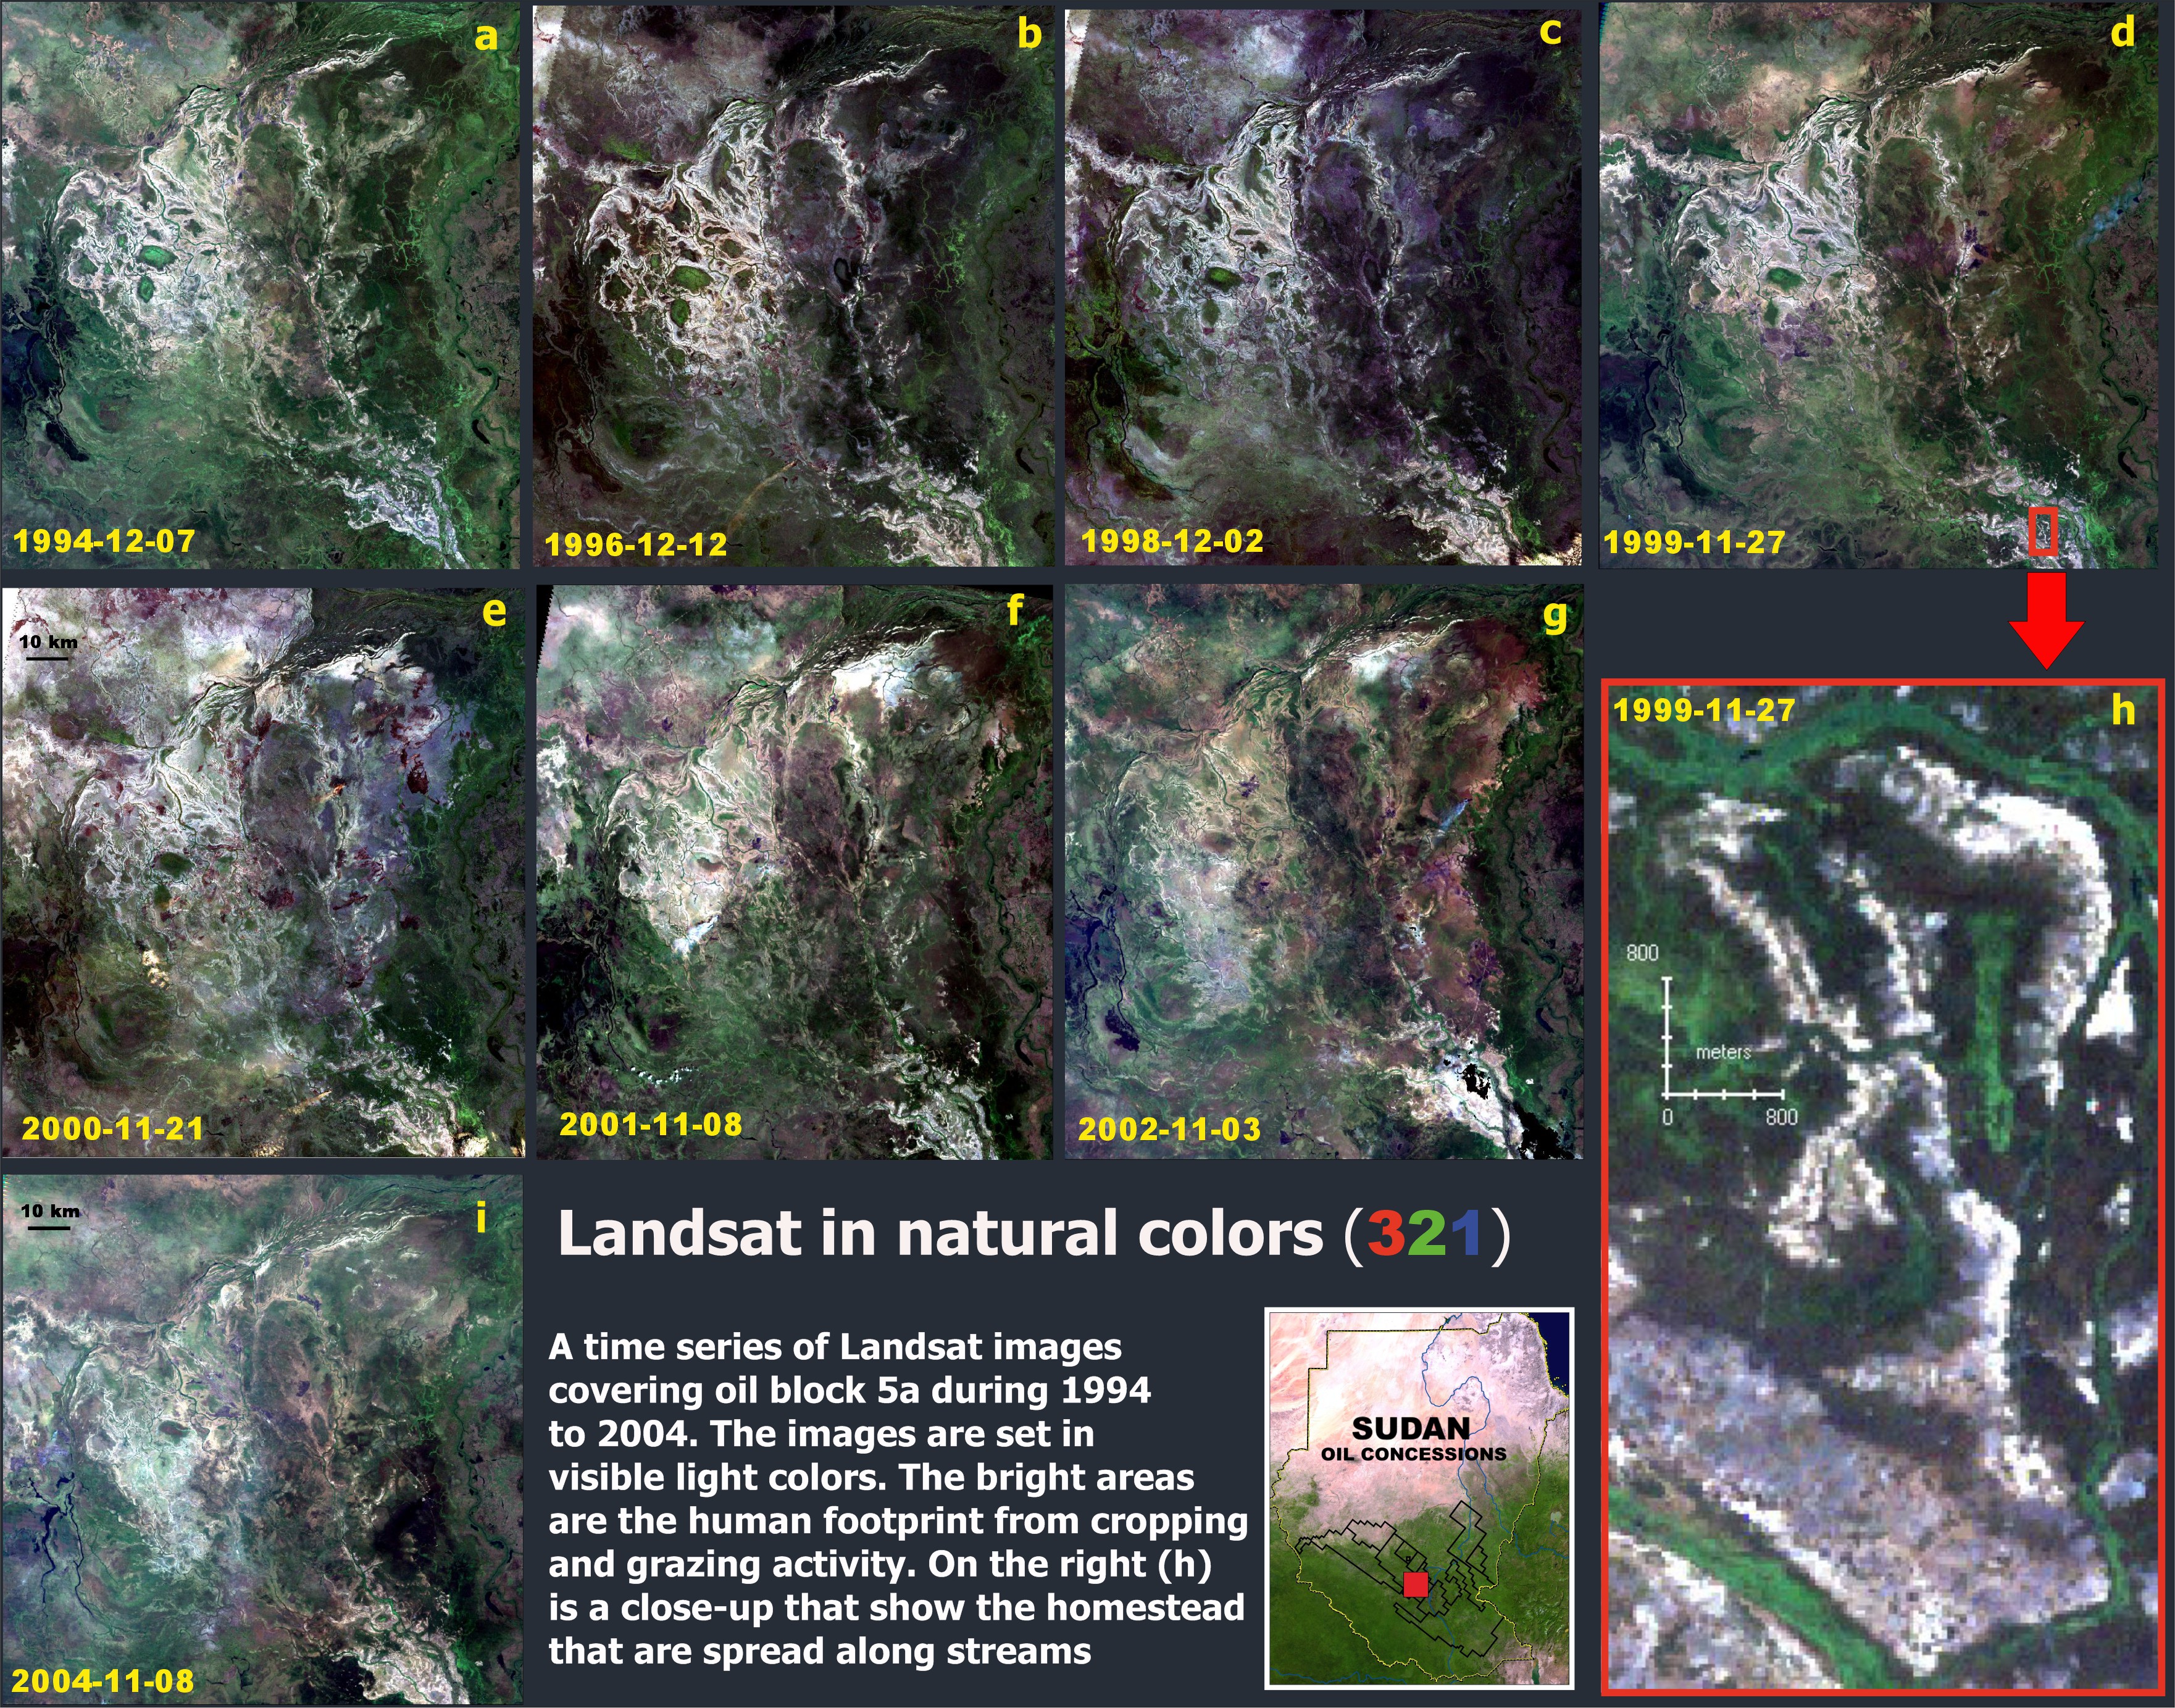
Fig 6: Series of early dry season Landsat
images (1994–2004) illustrating shifting farming concentrations along sandy
levees.
Fig 7–8: Examples of how transhumance
movement and bushfires can obscure—but intense activity still reveals—human and
livestock presence.
Key Takeaways
Robust Change Detection:
Consistent patterns across unsupervised classification, VHR verification, and
change detection align closely with mass displacement reports.
Seasonal Timing: Early dry season (November) images
maximize contrast between human footprint and lush regrowth, minimizing bushfire
noise.
Method Validity: Peer reviewed methods achieved high
mapping accuracy, with conservative thresholds ensuring certainty.
Explore More
• Full reports, datasets, and publications are available via the
buttons below.
• Engage with our front end Earth Observation tools documenting human rights
applications.
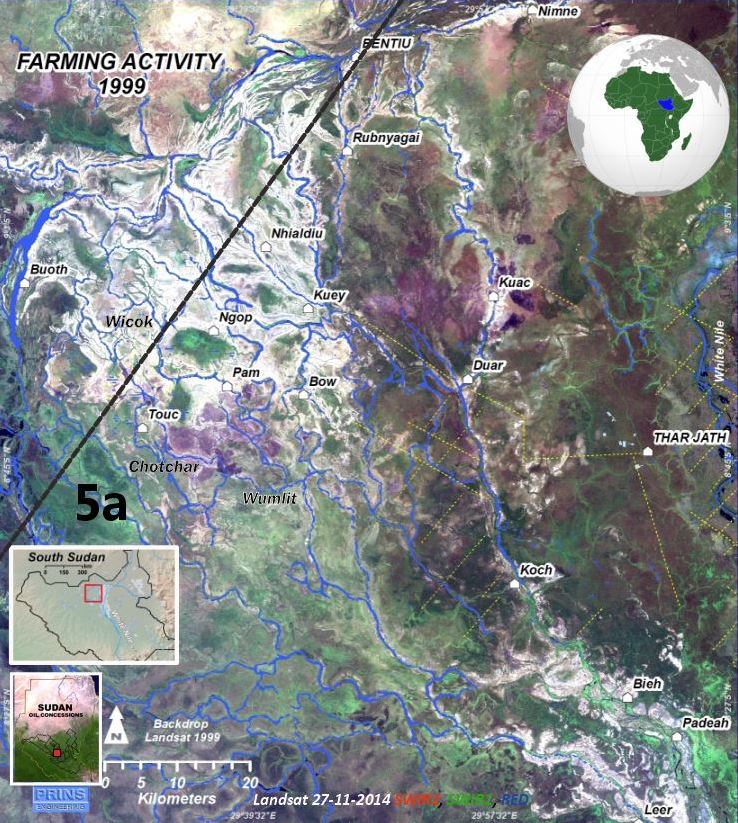
Figure 1. Landsat natural-color image (Bands 3,2,1) of
Oil Block 5A (27 Nov 1999). The flat, seasonally flooded plain of South Sudan is
bisected by the White Nile. Lush vegetation appears green; exposed soil from
intensive cattle farming appears whitish. Major towns are labeled, watercourses
in blue, and the eastern block boundary outlined. Seismic survey grids are
digitized in yellow. Image predates construction of the all-weather road from
Leer via Thar Jath to Bentiu.
Files, reports, links and pdf are found
in the button of this page
The
traditional land use
The study area lies adjacent to the White
Nile and the
Sudd wetlands, a flat landscape characterized by
seasonal inundation. Grasslands and wooded savanna dominate, managed by
Nuer and
Dinka agro-pastoralists. Much of southern Sudan
consists of floodplains and marshes ideally suited to their
transhumant
lifestyle, in which cattle outnumber people.
- Settlements:
Permanent villages—clusters of circular mud huts (“tukuls”) with thatched
roofs—sit on natural river levees just above flood levels. Often, cattle huts
(larger than human dwellings) form part of these homesteads, which lie along
streams.
- Wet Season
(May–Nov): Families and their herds remain at
these elevated homesteads, growing and harvesting crops by November.
- Dry Season
(Nov–May): Herds range widely (30–100 km/day)
into floodplain and riverine wetlands for fresh grasses.
Grazing around homesteads exposes soil and
degrades vegetation, but most areas recover each rainy season—except where
overgrazing or permanent structures impede regrowth. In this study, severe
degradation was limited, confined to some settlement centers (e.g.,
Boaw).
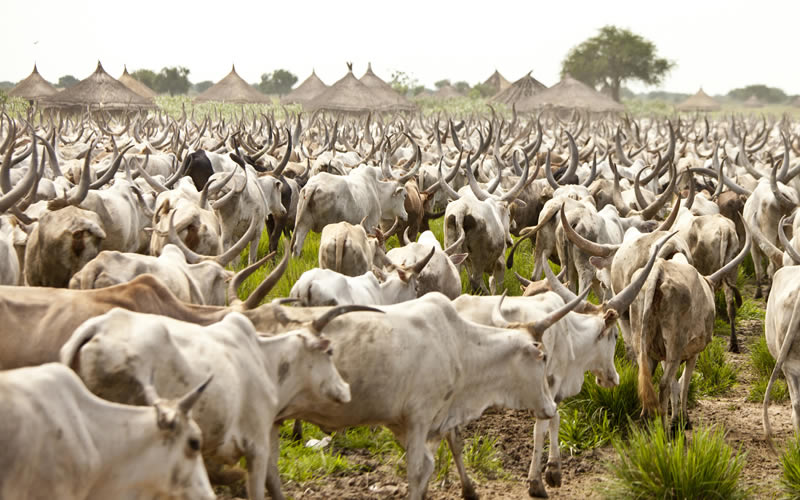
Figure 2. High concentration of Nuer cattle (“abigar”)
grazing near homesteads. Nuer pastoralists—also called “Abigar people”—live in
conical thatch-roof huts (tukuls) visible in the background.
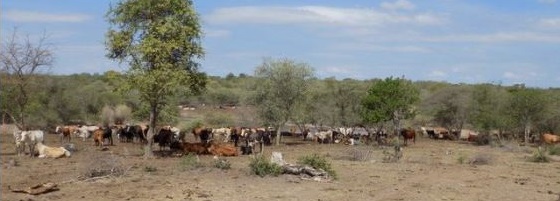
Figure 3. Cattle grazing footprint in multispectral
imagery. Repeated grazing exposes soil and degrades vegetation, producing a
bright signature easily detectable in Landsat data. (Photo credit: Peter Lawson)
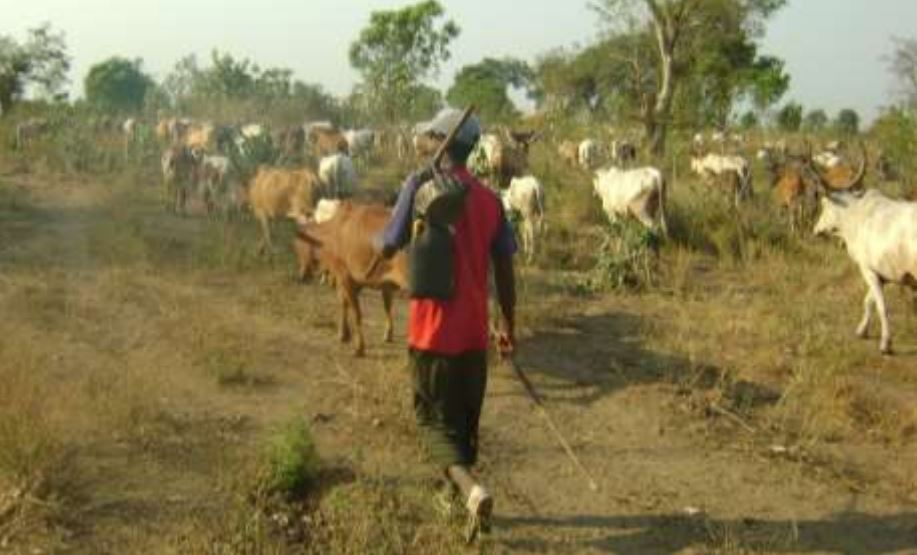
Figure 4. Seasonal cattle movement to wetlands. During
the dry season, livestock range into major floodplain areas near rivers to
access fresh grasses. (Photo credit: Nakachew Minuye)
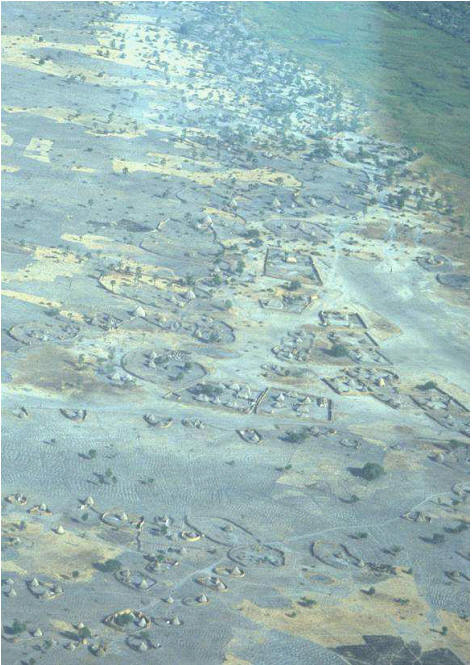
Figure 5. Typical village on natural levee. Aerial view
shows tukuls clustered on slightly elevated sandy banks. Bright grayish patches
are recently tilled fields; yellowish tones indicate dry grass or fallow land.
(Photo credit: Sharon Hutchinson)
Monitoring Agro-Pastoral
Land Use from Space
Data
Source & Timing
- Landsat 5 & 7
(16-day revisit) provided multispectral imagery since the mid-1980s.
- Early dry-season images
(November) offer the clearest contrast: bare-soil signatures from
post-harvest cropping and prolonged cattle grazing appear as bright
“footprints,” while lush regrowth still blankets surrounding grasslands.
Detection
Logic
- If a homestead’s bright footprint disappears or weakens
in the subsequent year’s November image, it indicates that people and cattle
were absent—evidence of displacement.
- Cloud-free, minimally noisy images are rare; for
1998–2002, only one or two suitable November scenes per year were available
for change-detection comparisons.
Spatial
Dynamics
- Figure 6 (125 × 128
km, Bands 3,2,1, 1994–2004): November images highlight green vegetation vs.
bright bare soils. Close-up (h) shows homesteads on elevated sandbanks (cf.
Figure 5). Vertisols appear as dark, moist soils.
- Dry-season challenges:
Transhumance and seasonal bush fires (Figure 7) can mask grazing footprints.
However, intense herding activity still produces bright signatures (Figure 8)
that override fire scars.
Why
Landsat?
- Multispectral sensitivity
to soil reflectance detects even light grazing, unlike visible-only VHR or
aerial imagery (Tueller 1989; Booth & Tueller 2003).
- Consistent archives
from 1984 onward allow reproducible, large-area time-series analysis.
- 30 m resolution may
miss small features but excels at capturing broad land-use patterns
unobservable in higher-resolution yet single-band images.
Analytical
Workflow (Prins 2009)
- Image Selection:
Choose least cloudy November scenes (1987–2006).
- Classification:
Apply unsupervised ISODATA (60 classes) in ERDAS Imagine Pro; merge the two
brightest classes to delineate the traditional land-use footprint.
- Change Detection:
Generate Boolean maps to visualize spatial and temporal patterns of expansion
or disappearance of the footprint, corroborating displacement events reported
on the ground.
- Verification:
Exclude cloud-contaminated pixels (minimal impact) and confirm patterns with
independent ground reports (Christian Aid, HRW, ECOS).
This approach revealed a
72–99% reduction in traditional land use
across focus areas between 1999 and 2003, fully consistent with documented mass
displacements. No other plausible explanation emerges from the Landsat archive.
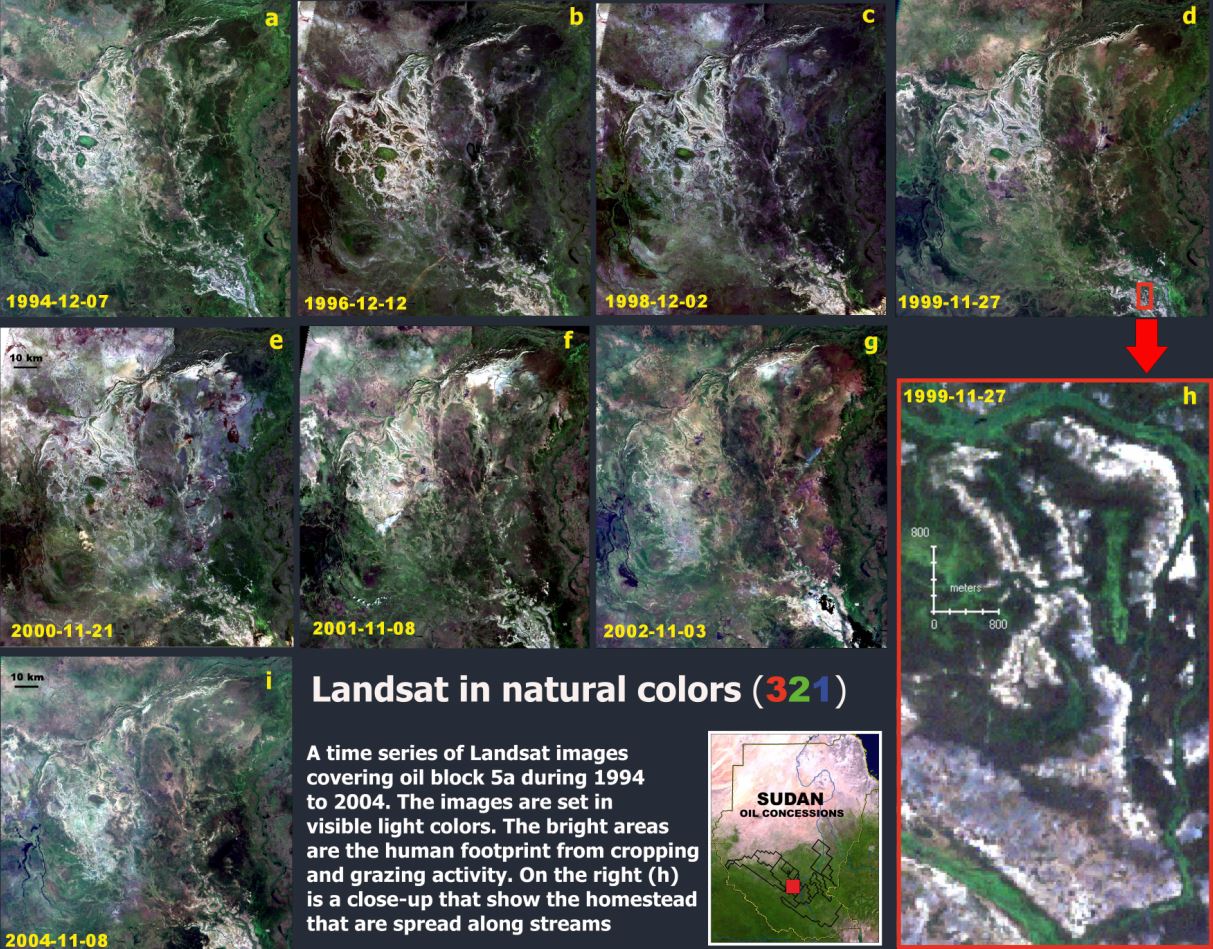
Figure 6. Time series of early-dry-season Landsat images
(1994–2004 -
higher
resolution image here
). Natural-color frames (Bands 3,2,1) over a 125 × 128 km
area. Close-up (h) highlights homesteads on elevated sand banks—the same pattern
seen in Figure 5.
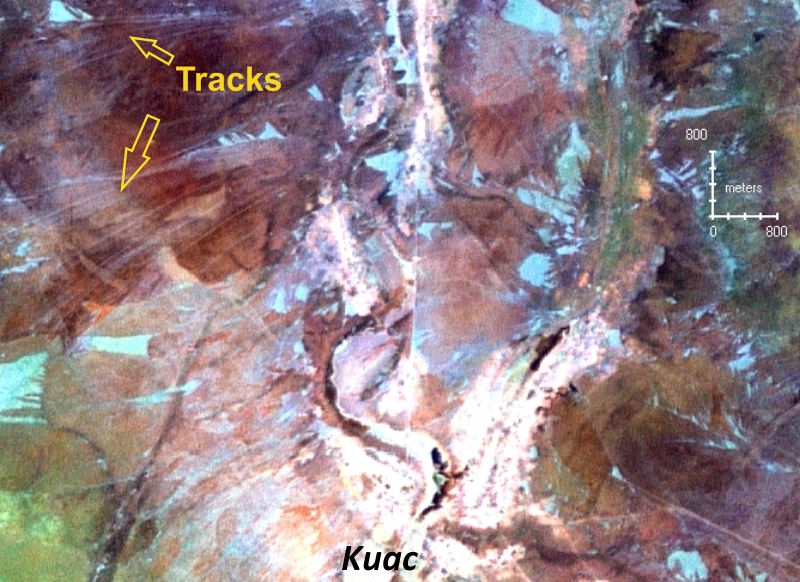
Figure 7a. Kuac settlement area at the onset of dry
season. Bush-fire scars (dark brown) partially mask light grazing footprints,
but concentrated cattle tracks (bright) still reveal livestock presence. A dried
stream bed with herding tracks is visible north of Kuac.
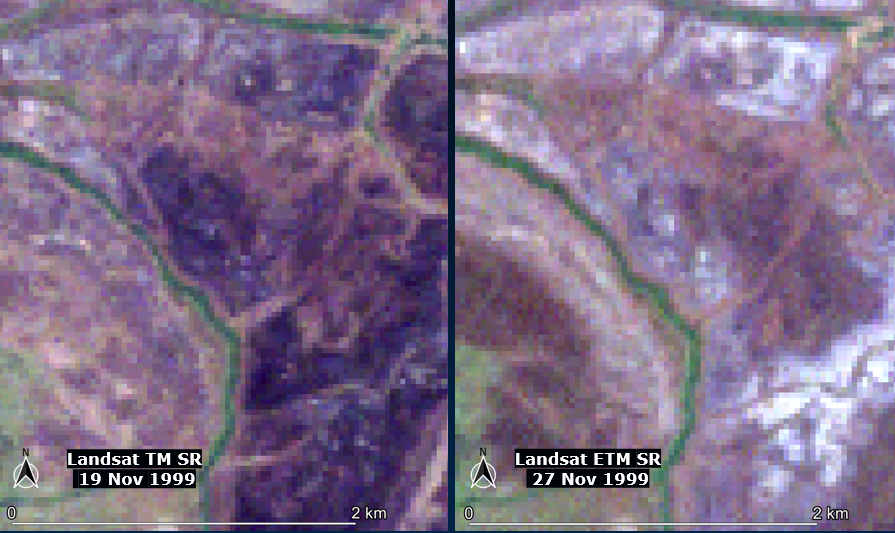
Figure 7b: Example of how
farming activity will overrule the effect of bush fires. This case show an area
beteen Touc and Wumlit where active farming activity neutralize the effectie of
an bushfire scare within 8 days. This means, if recent farming activity is
presence it will overrule the bushfire effect and will e.g., be captured by a
ISO-classifier.

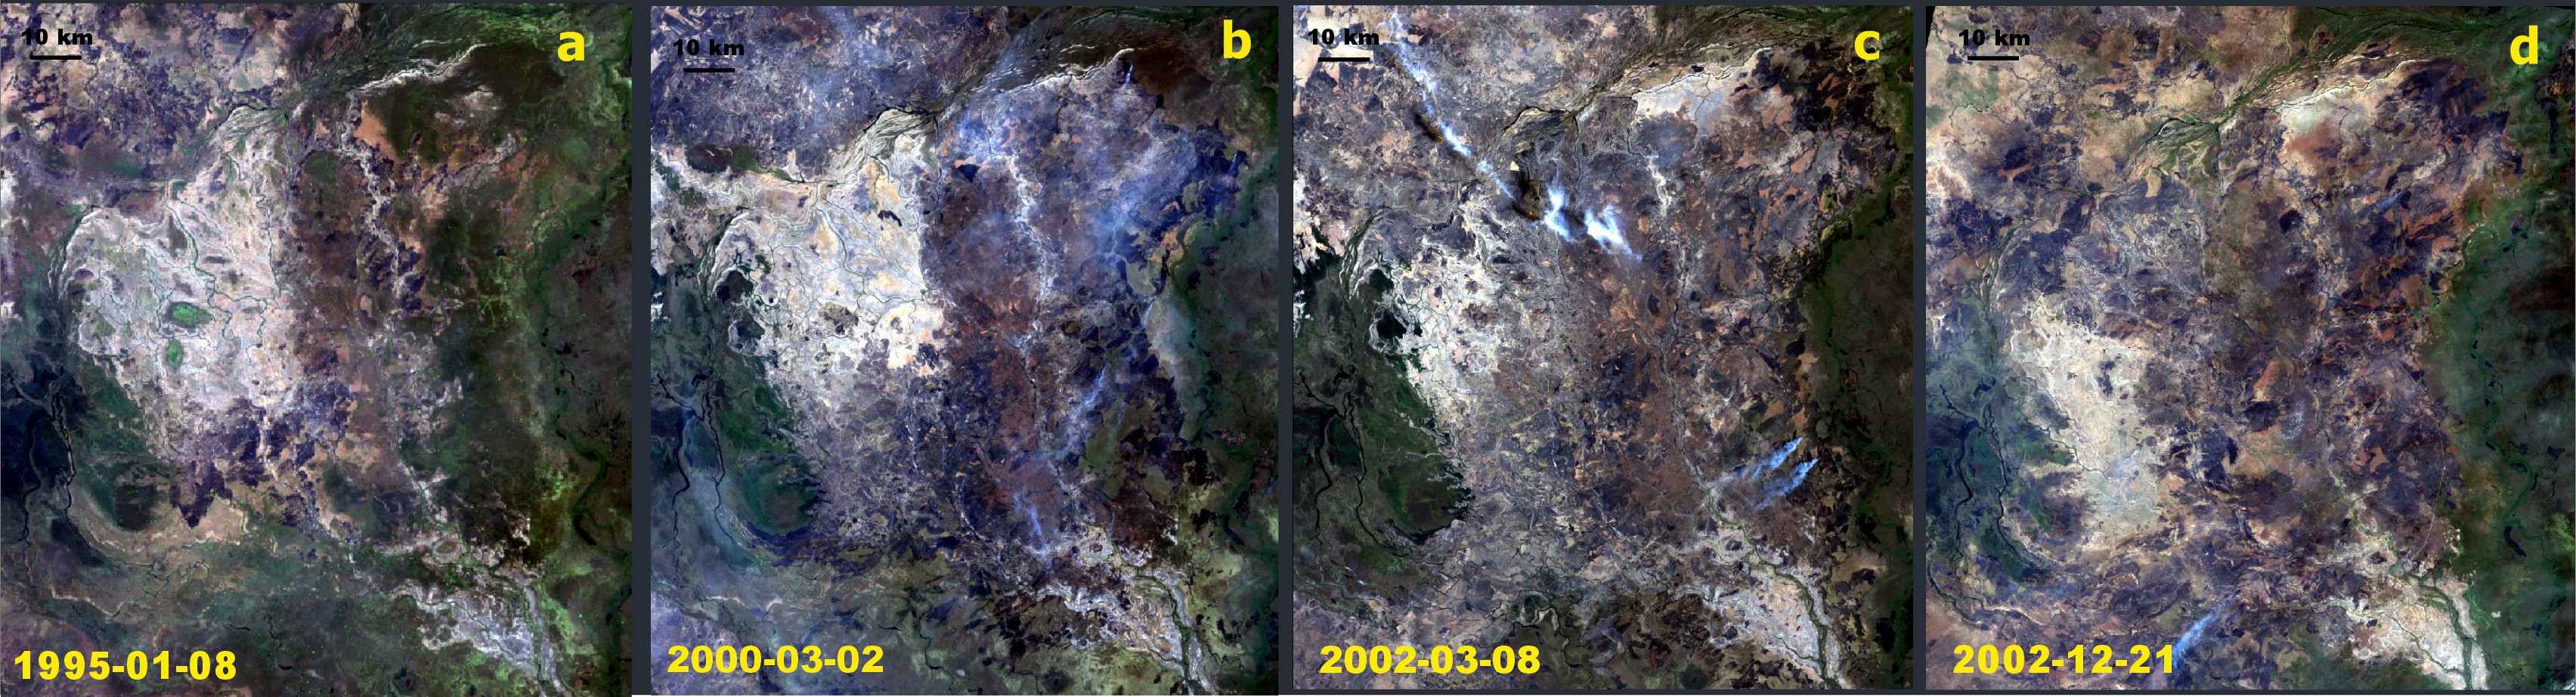
Figure 8. Dry-season change (1995–2002). Four Landsat
scenes show consistent bright farming footprints in 1995 (a) and 2000 (b). By
Mar 2002 (c), central footprints shrink while northeastern and southeastern
areas expand. By Dec 2002 (d), the farming signature has shifted south.
(higher
resolution image here).
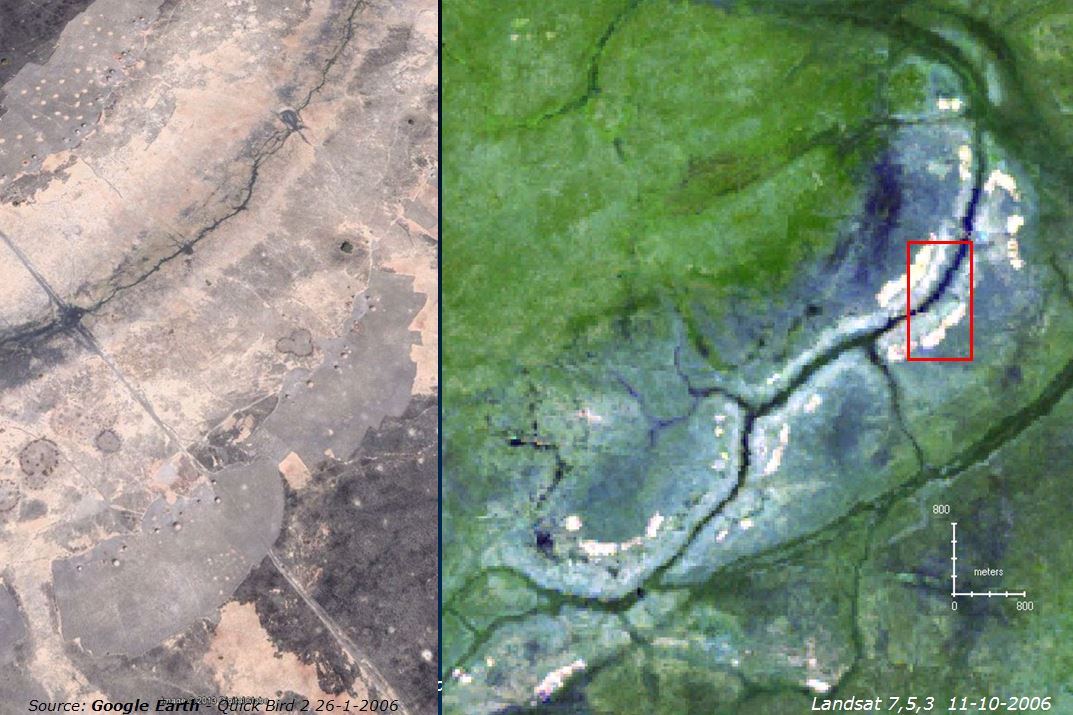
Figure 9. VHR vs. Landsat comparison. Left: QuickBird-2
(0.5 m) natural-color image showing huts and fields. Right: Landsat false-color
composite (Bands 7,5,3) with vegetation in green, bare fields in whitish, and
wet areas dark bluish. The red overlay on the Landsat panel indicates the VHR
coverage.
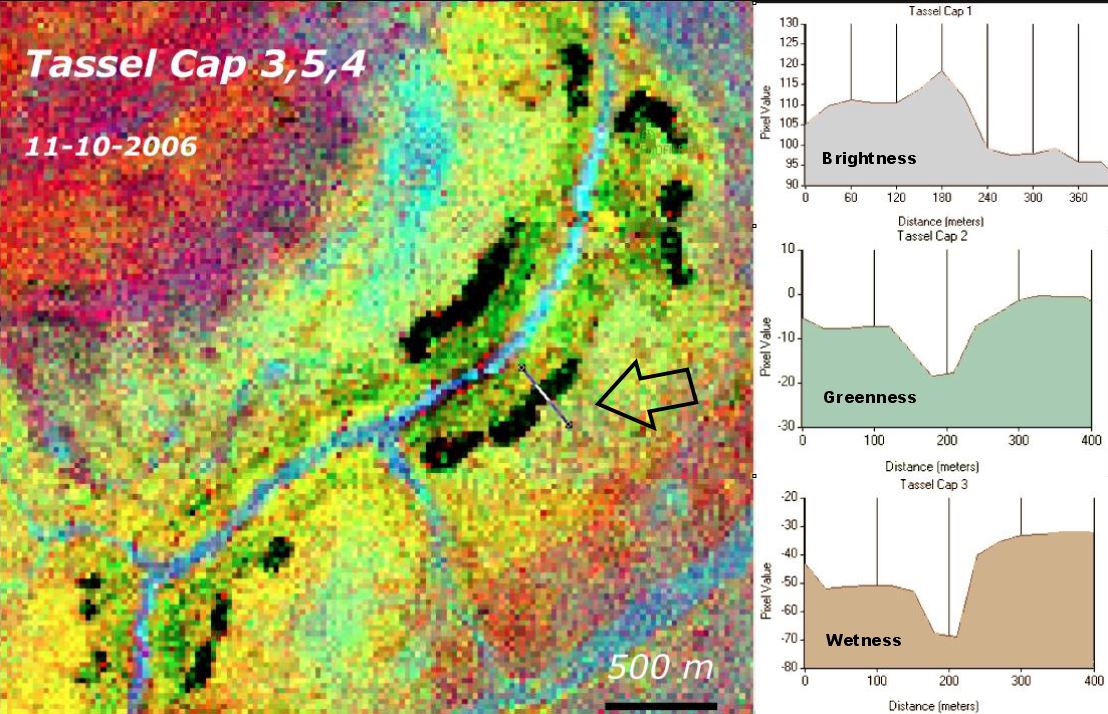
Figure 10. Tasseled Cap transformation of Figure 9 area.
Derived brightness, greenness, and wetness layers highlight biophysical
contrasts—bare fields appear dark and dry compared to surrounding vegetation in
the scenario. The transect line shows spectral response across the farm field.

Figure 11. Unsupervised ISO classification (60 classes)
for late 1994–early 1995. Two classes capture the seasonal land-use footprint,
illustrating consistent high concentrations of farming activity before oil
development. Settlement patterns match 1980s Russian maps.
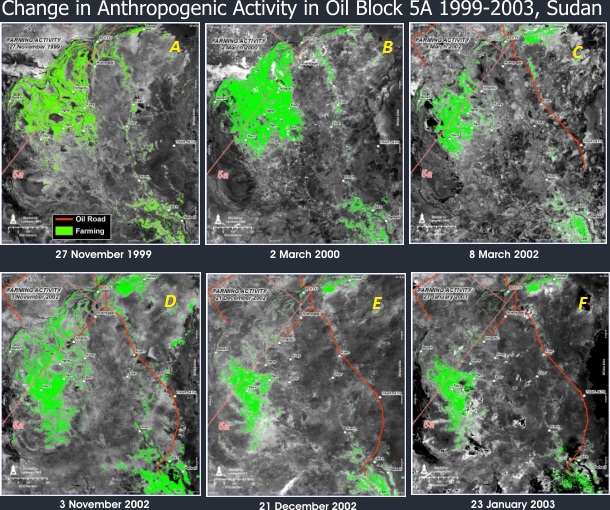
Figure 12. Sequence of ISODATA classifications (late
1999–early 2003). A) Traditional land use concentrated in Nhialdiu. B) Early
dry-season expansion after reported attacks along the oil road. C) Post-attack
shift southwest toward Wicok and Chotchar. D) Peak farming footprint in
south-southwest, matching reported displacement. E–F) Continued footprint in the
southwest amid seasonal bush fires.
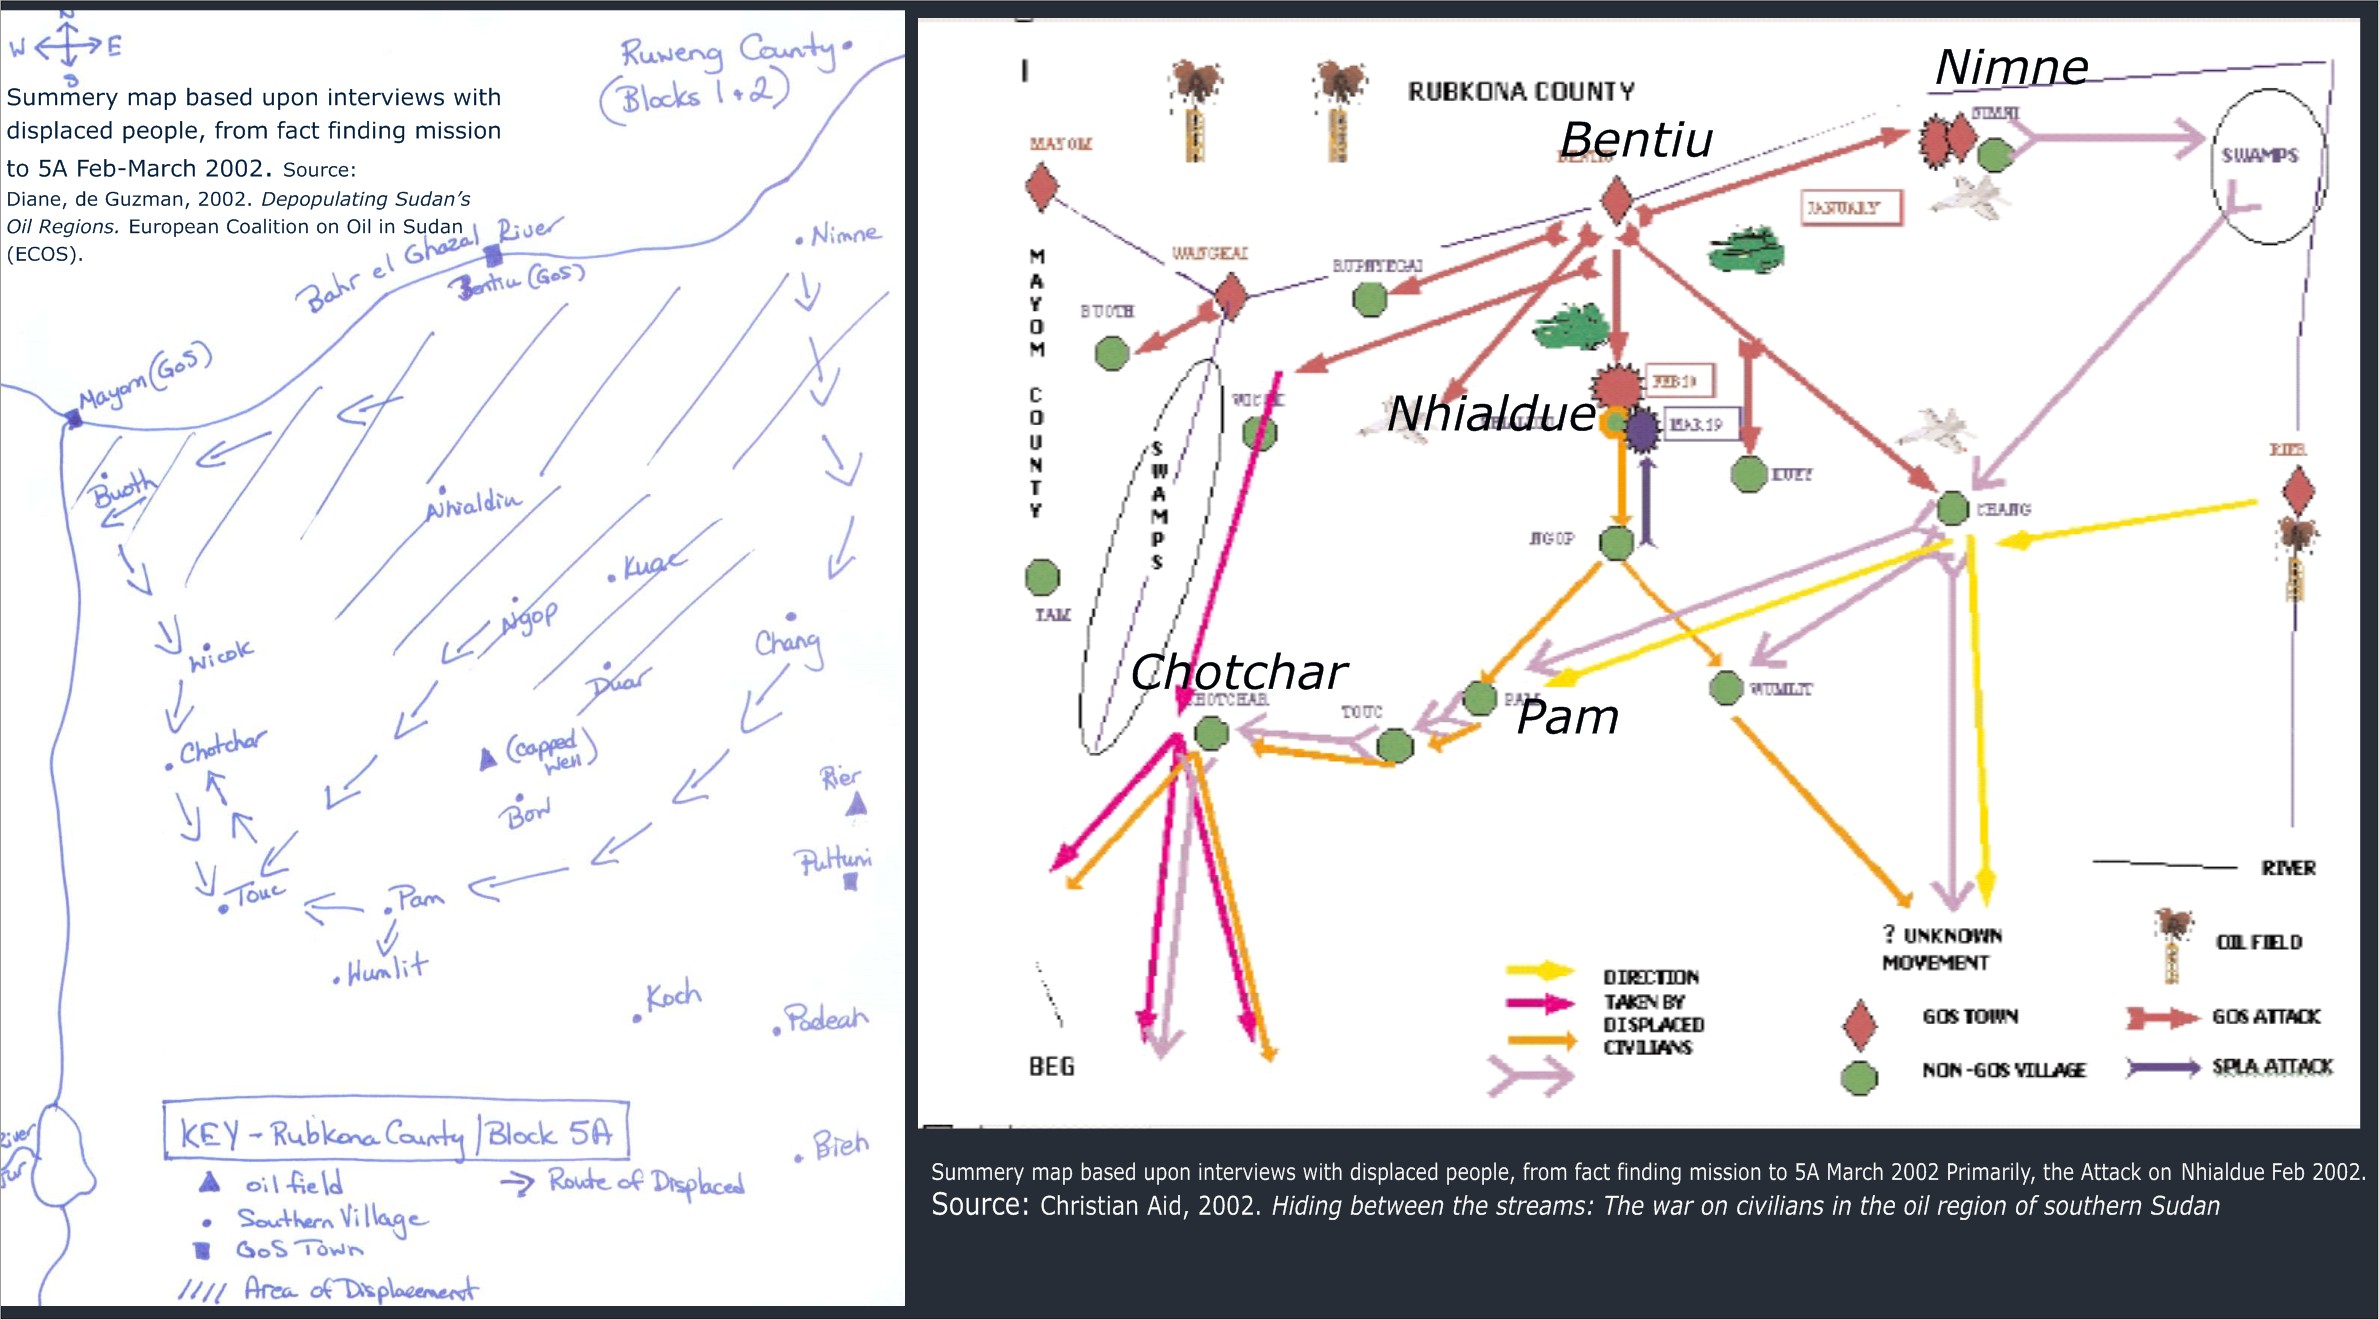
Figure 13. Questionnaire-based displacement maps (Feb–Mar 2002). Local
interviews mapped village clearances, escape routes, and refugee destinations.
The maps also included escape routes the places where they ended up.
In summery, it showed a displacement from Nhialdiu area and most people were
first driven south west and then south.
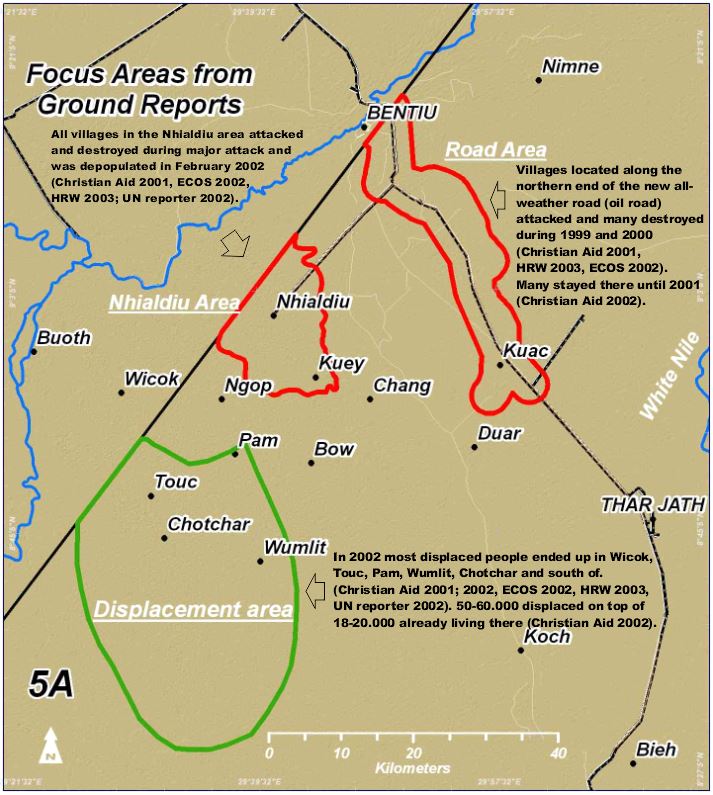
Figure 14. Focus areas for change detection. Three zones
within Oil Block 5A—northern oil-road buffer (2.5 km), Nhialdiu vicinity, and
southern displacement region—digitized from multiple ground-report sources
(e.g., HRW 2003).
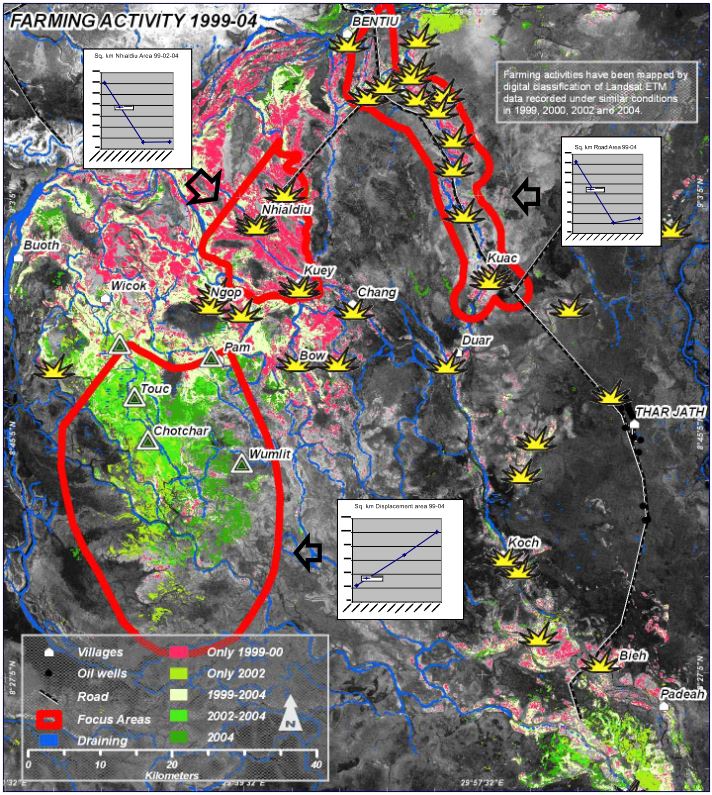
Figure 15.
Combined Landsat change and ground-report events (1999–2004). Yellow explosions
mark attacked settlements; green triangles indicate refugee camps. Change-map
statistics confirm reported desertions by end 2002 and increased land-use
activity in southern refugee zones.It can further
be seen that at the south end of the oil road - the area around settlement Bieh
show depopulation, which also have been reported (ECOS 2002; HRW 2003;
Sudanreevs;
Relifeweb 2002)
to be attacked several times during early 2002.
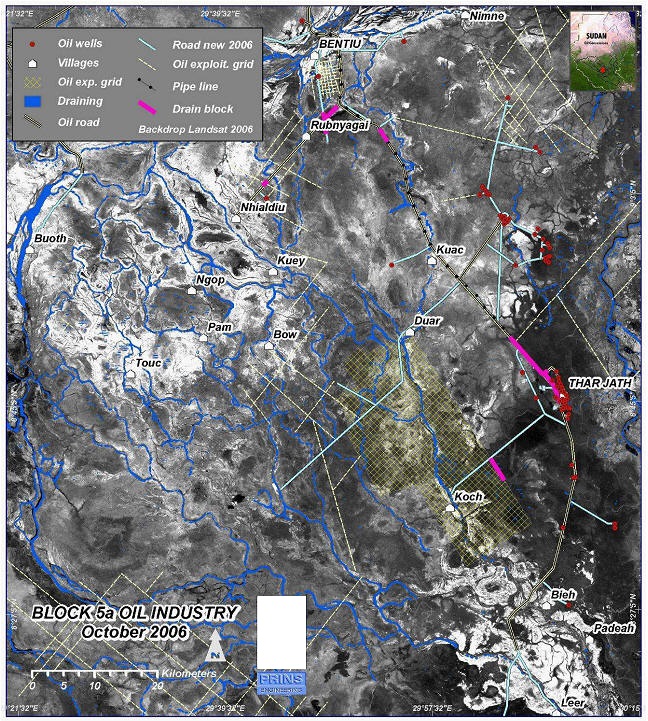
Figure 16. Oil infrastructure development (Oct 2006).
Digitized roads, drilling sites, and seismic lines over Landsat Band 7
(wetness-sensitive) reveal hydrological disruption by elevated all-weather roads
near Thar Jath.More detailed
image that show hydrological disturbance close to Thar Jath be viewed in the
here and in the Prins 2009 report.
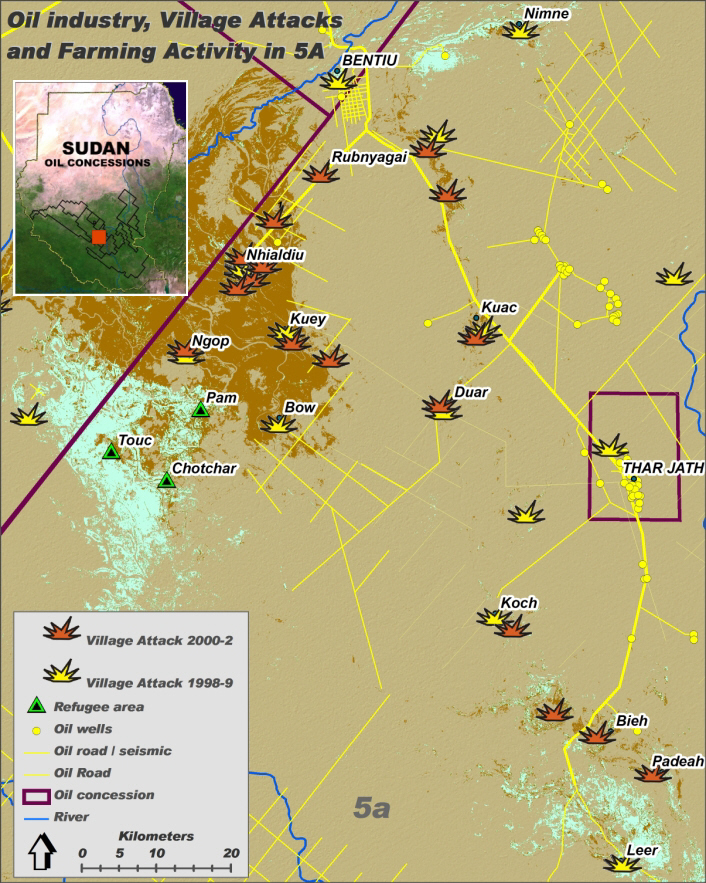
Figure 17. Integrated scenario of displacement and oil
development. Brown areas were active farmland in 2000 but abandoned by late
2002; bright green areas show new farming in late 2002. Overlaid are reported
attack locations and 2006 oil infrastructure.
Validation with
Very-High-Resolution Imagery (Post-2010)
With the advent of freely
available Google Earth VHR images (~0.5 m resolution), the Landsat-based
classifications could be evaluated at much finer scales:
- Training & Verification:
- Identified tukuls, farm fields, and degraded patches
in VHR scenes (e.g., 2003, 2006).
- Used these ground-truth points to verify November
Landsat classifications at 0.5–2 ha Minimum Mapping Units.
- Accuracy Assessment (Table 1):
- ISODATA (unsupervised):
Overall accuracy > 97 %, Kappa 0.81–0.86.
- CTA (Classification Tree
Analysis): Overall accuracy > 99 %, Kappa 0.96–0.99.
- Commission errors in ISODATA reflect conservative 10 %
pixel thresholds rather than misclassification of large areas.
- Error Matrix Metrics:
- Omission and commission errors quantified against VHR
reference.
- Kappa statistic employed per Fagan & De Fries (2009)
to gauge classification agreement.
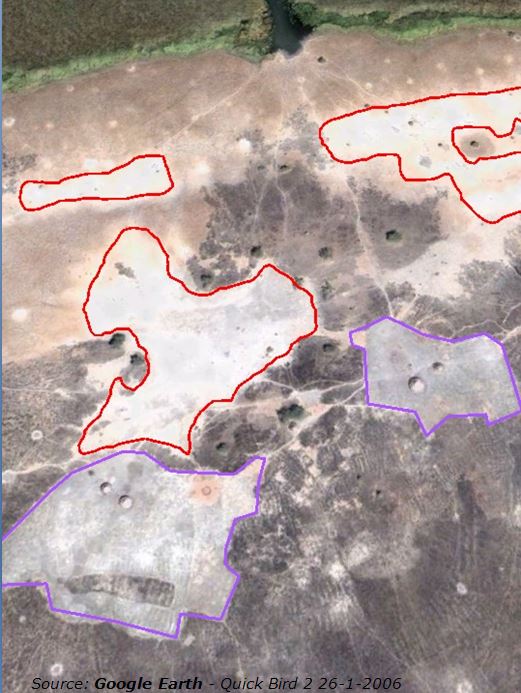
Figure 18. VHR farming area in late dry season. Circular
tukuls and adjacent degraded land (digitized for training) appear as very bright
patches. Dark gray zones indicate post-rainy-season bush-fire scars.
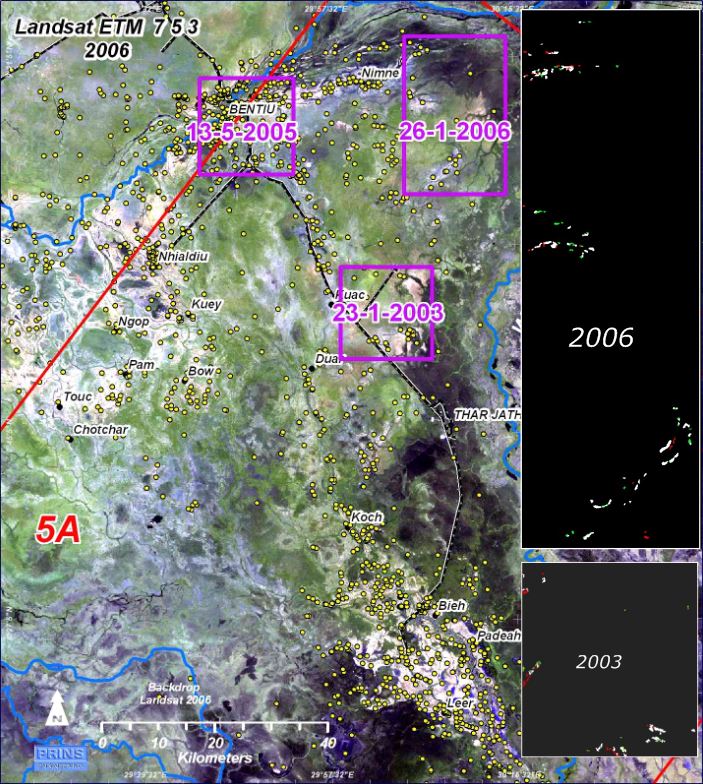
Figure 19. VHR-based accuracy assessment (Stockholm 2013
presentation). Google Earth VHR images and settlement databases (yellow dots)
support verification of Landsat classifications at 0.5–2 ha scales. Insets:
white = correct detections; green = commission errors; red = omission errors.
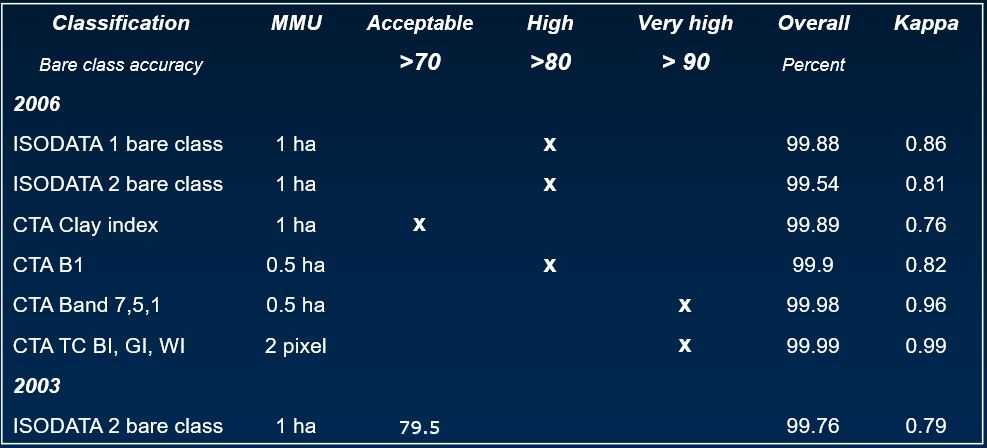
Table 1. Accuracy assessment of classification methods
using QuickBird-2 VHR as reference. ISODATA (unsupervised) and CTA (supervised
tree classifier with indices) both achieve high overall accuracy and Kappa
statistics (per Fagan & De Fries 2009). CTA yields very fine-scale mapping at
settlement level given the chosen MMU (Minimum Mapping Unit).
Advanced Time-Series
Methods
Beyond categorical maps,
narrow inter-calibration of Landsat bands enables continuous change
detection:
- Blue-band differencing (Band 1,
450 nm):
- Calibrated across years to isolate subtle
soil-reflectance changes.
- Figure 20 illustrates 1999 vs. 2002 blue-light
anomalies, highlighting emerging bare-soil areas.
- Monitoring System Development:
- Continuous-value time series support automated
detection of gradual degradation or sudden displacement.
- Potential for real-time alerts in humanitarian crises
and rangeland management.
Further advances and details can be viewed in the Prins (2018)
and the
peer-reviewed
summery.
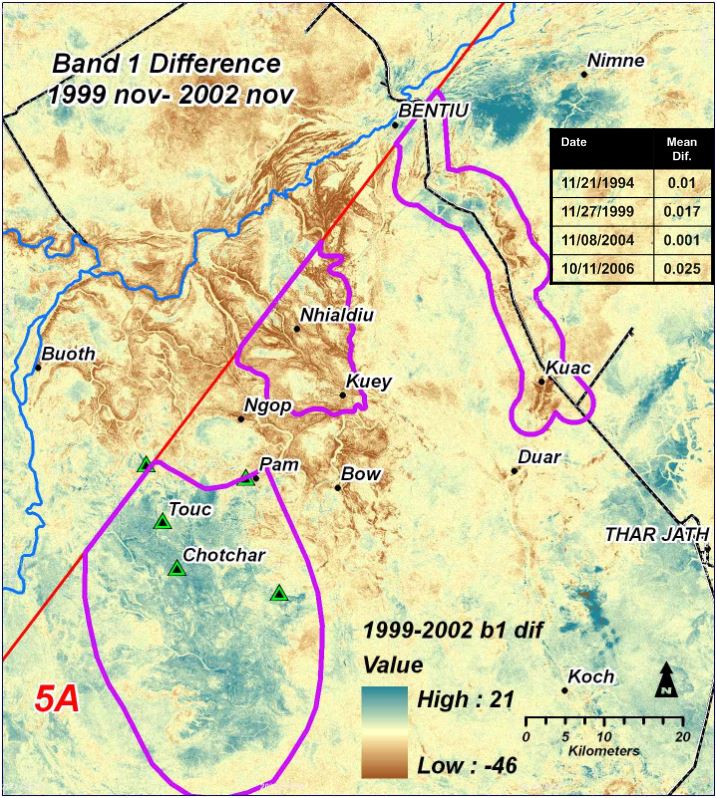
Figure 20.
Blue-band change detection (1999 vs. 2002). Landsat Band 1 (450 nm) is narrowly
calibrated across years to isolate bare-soil reflectance changes, clearly
delineating shifts in farming extents.(see more in
scientific summery).
Conclusion
Overall the results of the satellite mapping (Prins 2009;
Stockholm 2013
presentation) fully collaborate and detail the
ground reports of mass displacement of people in oil block 5a during 1999-2003.
- Strong concordance
between Landsat-derived land-use change and independent ground reports of mass
displacement (1999–2003).
- Early dry-season imagery
(November) consistently captures maximum human-activity footprints;
dry-season dynamics (transhumance, fires) introduce interpretive challenges
that intensive grazing can still overcome.
- Unsupervised ISODATA
classification proved highly effective for large-scale pattern mapping; CTA
further refines results at finer resolutions.
- VHR validation
confirms Landsat’s capacity to detect even light grazing signatures that may
elude aerial or single-band analysis.
- Multi-decadal Landsat archives—combined
with modern VHR cross-checks—provide objective, reproducible evidence of human
displacement and ecosystem change.
- Future applications
include population-level displacement estimates, rangeland health monitoring,
and rapid-response mapping in conflict or disaster zones.
Supplements:
PRINS KEY-NOTE SPEAKER AT THE SWEDISH SPACE DAYS 2013:
Global reporting interpretation of speach
 pdf PRESENTAION OF THE 5A CASE AND ANALYSIS - INVITED TALK REMOTE SENSING DAYS
STOCKHOLM 8 APRIL 2013
pdf PRESENTAION OF THE 5A CASE AND ANALYSIS - INVITED TALK REMOTE SENSING DAYS
STOCKHOLM 8 APRIL 2013
pdf REPORT TO ECOS 2009:
Satellite mapping of land cover and use in relation to Oil exploitation in
concession 5A
Client of the 2009 report: The European Coalition on Oil in Sudan (ECOS)

References:
Aljazeera.
2015. Accessed 26 September 2016. http://www.aljazeera.com/indepth/features/2015/
05/south-sudan-man-catastrophe-150525120843494.html
Bastin, G.
N., G. Pickup, V. H. Chewings, and G. Pearce. 1993. “Land Degradation Assessment
in Central Australia Using a Grazing Gradient Method.”
The Rangeland Journal 15 (2): 190–216. doi:10.1071/RJ9930190.
Booth, D.T.,
and P.T. Tueller. 2003. Rangeland monitoring using remote sensing. Arid Land
Research and Management 17 (4): 455–467.
Christian
Aid. 2002. Hiding between the Streams: The War on Civilians in the Oil Region of
Southern Sudan.
http://www.christian-aid.org.uk/indepth/0205suda/sudanrpt.pdf
de Guzman, D., 2002.
Depopulating Sudan’s Oil Regions. European Coalition on Oil
in Sudan (ECOS).
http://www.ecosonline.org/back/pdf_reports/2002/depopulating%20sudans%20oil%20regions.pdf
Fagan,
Matthew, and Ruth DeFries. "Measurement and monitoring of the world’s forests: A
review and summary of remote sensing technical capability, 2009–2015." UMBC
Geography and Environmental Systems Department Collection (2009).
Google Open
Street Maps. 2015. “The Humanitarian Openstreetmap Team.” https://www.hotosm.
Org
Holling, C.
S. 1973. Resilience and stability of ecological systems. Annual Review of
Ecology and Systematics 4:1-23
HOT. 2016.
Project - South Sudan, Unity State, Bentiu. The Humanitarian OpenStreetMap Team.
http:// tasks.hotosm.org/project/396
HRW. 2003.
“Human Rights Watch (November 2003). Sudan, Oil and Human Rights. 754 p.
Accessed 26 September 2016.
http://www.hrw.org/reports/2003/sudan1103/9.htm#_ftn88#_ftn88
HRW. 2015.
“’They Burned It All’ Destruction of Villages, Killings, and Sexual Violence in
Unity State, South Sudan: Report.” 42 p. Accessed 26 September 2016. https://www.hrw.org/sites/default/
files/report_pdf/southsudan0715_web_0.pdf
James, C.
D., J. Landsberg, and S. R. Morton. 1999. “Provision of Watering Points in the
Australian Arid Zone: A Review of Effects on Biota.”
Journal of Arid Environments 41 (1): 87–121. doi:10.1006/jare.1998.0467.
Lemenkova,
Polina. "ISO Cluster classifier by ArcGIS for unsupervised classification of the
Landsat TM image of Reykjavík." Bulletin of Natural Sciences Research 11.1
(2021): 29-37.
Maynard, C.
L., R. L. Lawrence, G. A. Nielsen, and G. Decker. 2007a. “Ecological Site
Descriptions and Remotely Sensed Imagery as a Tool for Rangeland Evaluation.”
Canadian Journal of Remote Sensing 33 (2): 109–115. doi:10.5589/m07-014.
Maynard, C.
L., R. L. Lawrence, G. A. Nielsen, and G. Decker. 2007b. “Modeling Vegetation
Amount Using Bandwise Regression and Ecological Site Descriptions as an
Alternative to Vegetation Indices.” GIScience & Remote
Sensing 44 (1): 68–81. doi:10.2747/1548-1603.44.1.68.
Olofsson,
P., G. M. Foody, M. Herold, S. V. Stehman, C. E. Woodcock, and M. A. Wulder.
2014. “Good Practices for Estimating Area and Assessing Accuracy of Land
Change.” Remote Sensing of Environment 148: 42–57. doi:
10.1016/j.rse.2014.02.015.
Phillips, S.
J., R. P. Anderson, and R. E. Schapire. 2006. “Maximum Entropy Modeling of
Species Geographic Distributions.” Ecological
Modelling 190 (3): 231–259. doi:10.1016/j. ecolmodel.2005.03.026.
Pontius, R.
G. Jr, and M. Millones. 2011. “Death to Kappa: Birth of Quantity Disagreement
and Allocation Disagreement for Accuracy Assessment.”
International Journal of Remote Sensing 32 (15): 4407–4429.
doi:10.1080/01431161.2011.552923
Erik Prins (2018) Landsat
approaches to map agro-pastoral farming in the wetlands of southern
Sudan, International Journal of Remote Sensing, 39:3, 854-878, DOI: 10.1080/01431161.2017.1392634
Samain, O.,
L. Kergoat, P. Hiernaux, F. Guichard, E. Mougin, F. Timouk, and F. Lavenu. 2008.
“Analysis of the in Situ and MODIS Albedo Variability at Multiple Timescales in
the Sahel.” Journal of Geophysical Research:
Atmospheres 113: D14. doi:10.1029/2007JD009174
Stehman, S.
V. 2004. “A Critical Evaluation of the Normalized Error Matrix in Map Accuracy
Assessment.” Photogrammetric Engineering & Remote Sensing 70 (6): 743–751.
doi:10.14358/ PERS.70.6.743
Tueller, P.
T. 1989. “Technology for Rangeland Management.” Invited Synthesis Paper 42 (6):
442.
UNHRC. 2016.
“UN Human Rights Council.” Assessment mission by the Office of the United ations
High Commissioner for Human Rights to improve human rights, accountability,
reconciliation and capacity in South Sudan: detailed findings, 10 March 2016, A/HRC/31/CRP.6.
Accessed 26 April 2016.
http://www.refworld.org/docid/56e2ee954.html
UNMISS 2015:
UN Mission to South Sudan. 2015. “2015, Flash Human Rights Report on the
Escalation of Fighting in Greater Upper Nile.” April/May, June 29. Accessed 26
April 2016.
http://www.refworld.org/docid/5592995c4.html
Unosat.
2016. “UNOSAT LIVE Map for South Sudan Complex Emergency (CE20131218SSD).”
Accessed 26 September 2016.
https://unosat.maps.arcgis.com/apps/webappviewer/index.html
id=cac78381476c43ebb98a7e642211809d
UNOSAT.
2015. “Rapid Damage Assessment of the Area of Rapid Damage Assessment of the
Area of Ngop Ngop, Unity State, South Sudan.” Accessed 26 September 2016.
http://unosat-maps. web.cern.ch/unosat-maps/SS/CE20131218SSD/Ngop_UNOSAT_20150518.pdf
Washington-Allen, R. A., N. E. West, R. Douglas Ramsey, and R. A. Efroymson.
2006. “A Protocol for Retrospective Remote Sensing–Based Ecological Monitoring
of Rangelands.” Rangeland Ecology & Management 59 (1): 19–29.
doi:10.2111/04-116R2.1.
privacy@prins engineering.com
About Us |
References
|
Services |
CV's |
Contacts |
Press
Copyright © PRINS, Eng. 2026