Satellite-Based Analysis in Sudan’s Oil Fields Presented in Swedish Court
The mid-resolution satellite work conducted in the oil
fields of Sudan has reached a milestone with its presentation in a Swedish
court. This work, which began in 2006, is now being shown to an audience largely
unfamiliar with remote sensing, while also facing opposition that is expected to
scrutinize any technical detail in an attempt to discredit the analysis.
This creates a unique and challenging situation—one that
highlights both the potential and the perceived limitations of mid-resolution
remote sensing in legal contexts. On one hand, the legal system is traditionally
conservative and may expect visual evidence that is immediately clear to the
naked eye. On the other hand, technical explanations can be misunderstood or
seen as obfuscating the issue, potentially casting doubt on the validity of the
method. In this presentation, I have aimed to strike a careful balance between
scientific integrity and accessible communication.
Given the significance of this case and the importance of
further developing the methodology, I believe this analysis should be replicated
by others—whether for research or educational purposes—to assess whether a
different conclusion might be drawn about the displacement patterns in oil block
5a between 1999 and 2003.
Below you will find links to the Stockholm 2025
presentation, villages (village table with references and kml file -
attacks.zip), and other relevant data and information - see further below.
For replication or further analysis, users may find it easier to work with the
latest Landsat surface-calibrated data, which can be downloaded from the USGS
Earth Explorer (Landsat Collection 2, Level 2), or accessed via platforms
like
Google Earth Engine or
ClimateEngine.org.
 Stockholm powerpoint presentation June
2025
Stockholm powerpoint presentation June
2025
 References on Village attacks and kml file
Breaking News – 25 August 2025
The Lundin trial continues to break new ground with the use
of satellite images as evidence. According to BlockSpot.se (link),
yet another satellite-based expert has testified, following up on my own
presentation earlier this year.
This witness has presented a large number of maps, and the
Swedish police had requested a summary map to draw their conclusions. Based on
this summary, it was stated that no significant land-use change had occurred in
the area in question (interview 2018-09-17: 19 Stockholms TR B 11304-14 Aktbil
671, p. 6).
This conclusion was surprising. The mapping had relied
mainly on a visual comparison of two Landsat satellite images from 1995 and
2003. From my own work (Prins 2017), I highlighted the ISODATA classification
algorithm as effective. When I quickly re-analyzed the same images using
ISODATA, the results clearly showed patterns of displacement consistent with
numerous independent reports - such as the ground truth maps drawn by Diane
de Guzman (2002) and Christian Aid (2002).
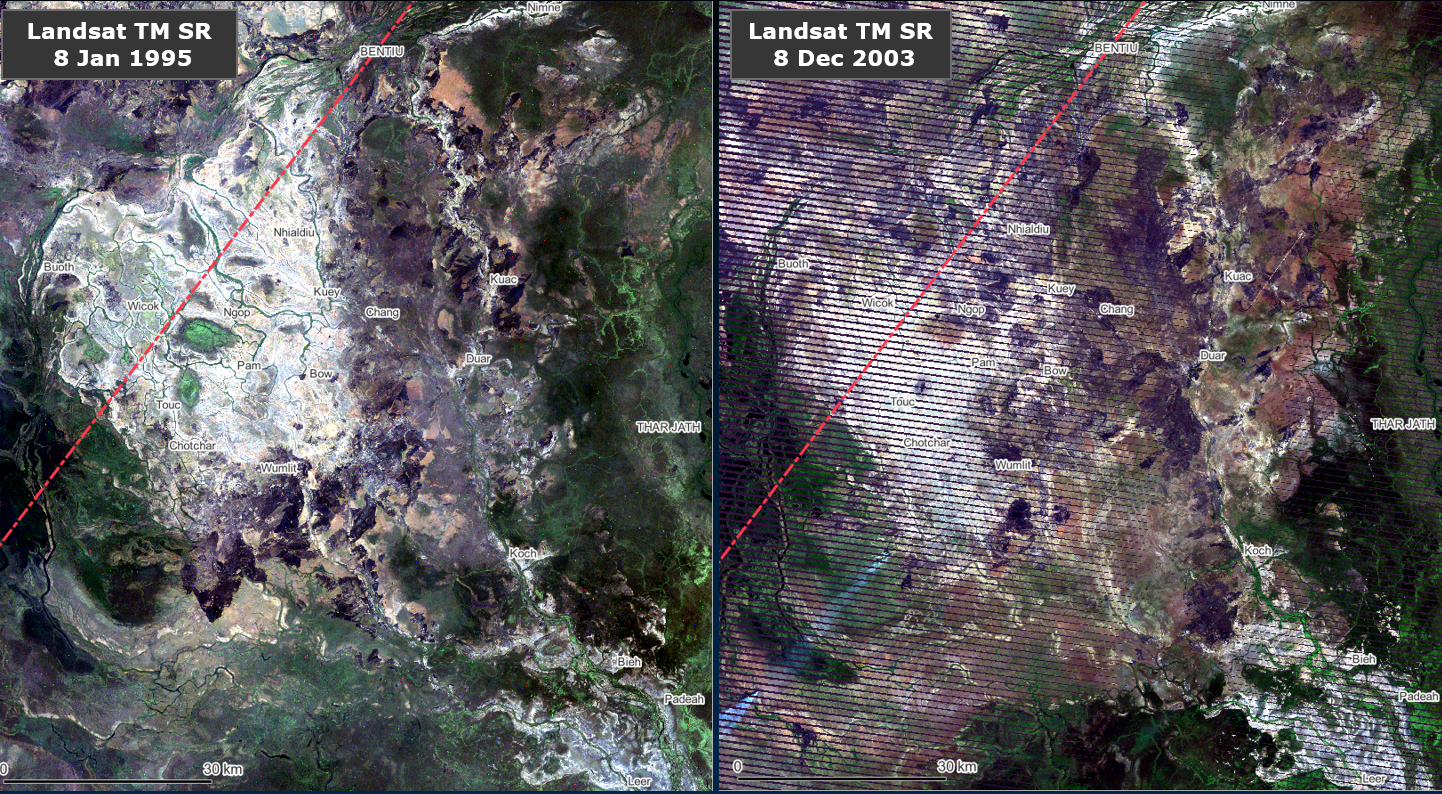
Landsat images shown in true colors - from 1995 and 2003 that was used to
conclude that no significant changed had taken place
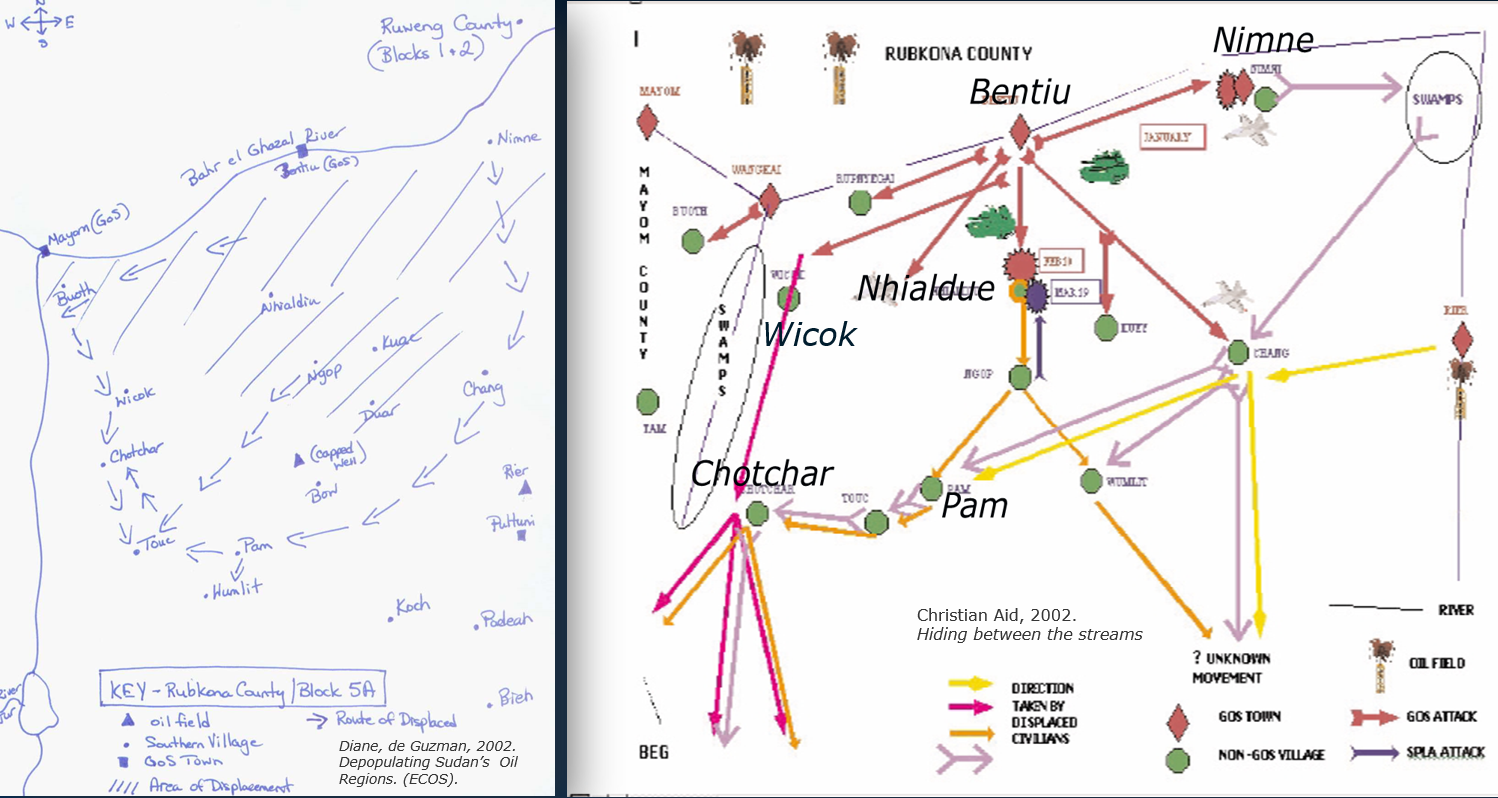
Example of ground truth maps: Two independent map developed from ground surveys
in 2002. E.g., remark on left map displacement areas (hatched) and where people
went to (arrows) that show a similar general pattern as below.

Two change detection maps based upon digital ISO-classicfactions - the one on
left (1995-2003) has just been processed after the reporting from Storckholm
court ('21-08-2025 Blankspot.se' ) that these images show no change in ground
activity. The map alines very well with the field maps (above), reports and in
addition the route taken by DanChurch in march 2002 during their assessment in
the refugue area. Why and how - the conclusions presented in the Stockholm court
can diviate so much - should be investigated. On the right is a chnage
(1999-2002) scenario processed in 2009 that alines with scientific publications
and a number of accuracy assessments.
Even though the 2003 Landsat data contained striping errors
(a known sensor issue), the analysis still revealed clear evidence similar to
the presented 1999-2002 scenarios. In late 2003 it can further bee seen that the
refugee areas are shrinking in both the north and south – indicating that the
fighting is halted. This matched the broader pattern seen in other sources.
To me, this - by other things! - highlights a recurring problem: relying too
heavily on visual interpretation risks missing the bigger picture. In this case,
it seems, at best, that the interpreter was caught by “the devil in the detail”.
Once again, the lesson is that carefully applied digital
analysis remains a far stronger tool for uncovering the truth on the ground.
-------------------- o -------------------------
UNITY STATE – MONITORING MASSIVE HUMAN ABUSES IN
SUDAN’S OIL FIELDS
Development of
EO
applications and monitoring
system reveals massive
land use changes in two periods 1999-2002 and 2014-2015
Erik Prins (2018) Landsat
approaches to map agro-pastoral farming in the wetlands of southern
Sudan, International Journal of Remote Sensing, 39:3, 854-878, DOI: 10.1080/01431161.2017.1392634
Background
work and introduction here
Overview
Following renewed humanitarian crises in Oil Block 5A during 2013–15,
abundant VHR (Very High Resolution) imagery on Google Earth enabled a thorough
reevaluation of Landsat’s capability to map agro-pastoral footprints and their
disruption. Prins (2018) extended his 2009 methodology by:
-
Applying VHR data to validate
Landsat-derived farming-activity predictions (see Table 1; Prins 2009, Prins
2018).
-
Setting a conservative 10 % pixel threshold:
only areas where agricultural activity covered ≥ 10 % of a 30 m Landsat pixel
were considered; below this, VHR interpretation proved too uncertain.
Table
1. Farming activity class definition and means to verification by VHR imagery.
Key Datasets (Table 2)
- Early dry-season Landsat scenes
(1999–2003; 2014–2015) when cropped homesteads and concentrated herds produce
the strongest bare-soil signatures.
- Top-of-Atmosphere (ToA)
calibration and inter-calibration
via invariant ground targets achieved consistent reflectance values
across years.
- Surface Reflectance (SR)
products—now freely available—confirmed these results by correcting
atmospheric effects, particularly in the visible blue band (Prins 2018, Table
3).
Table 2. Landsat data used in International Journal of Remote Sensing
publication (Prins 2018) included two essential images from the Prins 2009
report. The images are requested in early dry season that is best for rangeland
monitoring and in this case are when people are concentrated at homesteads for
crop harvest.
The five Landsat images were
calibrated to ToA and intercalibrated using invariant points, with a few
exceptions reached a remarkably close inter-calibration that allow multi-temporal
monitoring. Surface Reflectance (SR) that is a product that have under
development over the past decade showed a similar result. SR is useful as it
corrects for uneven atmosphere and can now be
acquired pre-processed for free. The uneven atmosphere is typically affecting
visible blue band, but Blue did not show channelling to calibrate for the time
series analysis. This was found both in Prins (2018) (see table 3
in Prins 2018 - calibrated data can be found
below) and in the imagery shown in the
Stockholm 2013 presentation that were
calibrated independently.
Table
3. Mean difference between spectral bands after inter-calibration (from Prins
2018).
The most successful EO application for
predicting farming activity
was the machine learning algorithm MaxEnt, which is traditionally used
in ecology for species prediction (Phillips et al 2006). However, so far, the
remote sensing community has only given MaxEnt limited attention. In this case it
outperformed all other traditional remote sensing classifiers. MaxEnt showed
outstanding predictability and across all years - apart from the NiR
band. This could be expected as farming areas in this environment could include
a range of factors that include bare areas, differences in soils, green
vegetation, and moisture, which the Landsat NiR band is sensitive to.
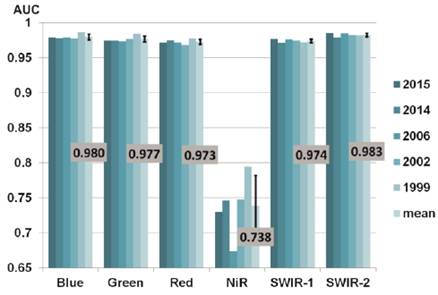
Figure
1. AUC values
of
individual Landsat bands produced by MaxEnt for each year and mean of all years
including SD. Apart from NiR band it shows remarkably high consistency and thus
high reliability for multi-temporal prediction and prediction of farming
activity.
A comprehensive analysis of
classifications algorithms as well as spectral bands and indices was preformed
from both the 2014 and 2015 image. The predictability of farming activity from
MaxEnt showed very strong across indices.
The strongest response collaborated
findings from recent years remote sensing research in rangeland management (fig
2). SWIR-2 (Landsat band 7) and furthermore indices of the Normalized Difference Tillage
Index (NDTI), Normalized Difference Infrared Index 7 (NDII7) as well as the Soil
Adjusted Total Vegetation Index (SATVI) showed strongest – they are considered
state of art indices for rangeland management. However, Blue band and SWIR-2
showed for both test years to independently produce among the highest overall
mapping accuracy > 97% (see Prins 2018 paper and showed a high Kappa
coefficient of approximately 0.85). MaxEnt using all bands and Tassel caps
outperformed all other methods with overall mapping
accuracy > 98.5% (very high Kappa 0.88-0.92). The ISO classifier produced overall
mapping accuracy > 97.2% (high Kappa 0.81-0.86) that outperformed most categorical
classifiers and thus confirms Tueller (1989) statement from that time, that
unsupervised classifiers tend to work better than supervised for rang lands. However, it should be noted that the uncertainties with ISO
classifier was linked with high commission errors. Or more specifically, it made the
farming areas larger which indicates it grabbed farming activity below the 10%
threshold (compare figure 3a and 6). As such,
the EO application for monitoring the effect of grazing / pastoral
utilisation has still much more to come for. Particular, in terms of quantifying
lighter grazing pressure and untangling the behind laying factors that appears
to be driven by vegetation cover and productivity, exposed and cattle trampling
of soils as well as dryness.
Figure
2. AUC values produced by MaxEnt for individual Landsat bands and indices showed
very high explaining ability, particular for indices and bands that have found
useful for Rangeland management.
When the farming prediction from
MaxEnt was put together as a standardized difference image (2014–2015),
depopulated or change areas could be identified at both settlement and state
levels. As shown in Figure 3 (b), there has been a significant decrease in
farming activity along the main roads as well as in the east central part of the
study area. This includes the Ngop area that has been documented by
UNOSAT (2015) as burnt
and the larger Boaw area that was reported to be severely terrorized and
destroyed in 2015 (Aljazeera 2015; HRW 2015; UNOSAT 2016). Interpreting a no
comprehensive mapping from Boaw area (Figure 3 b) in Google Open Street Maps
(2015) shows approximately 1500 housing structures and with average of 5 persons
in a household (personal communication Nils Carstensen, Christian Aid), this can
bring up realistic estimates of 10,000 people being driven off their land in the
Boaw area in 2015. The Landsat change product shows a similar overall pattern as
the UNOSAT (2016) VHR-based product of destroyed housing structures. However,
the Landsat application
covers an extortionate larger area, and still allows identification of specific destroyed
settlements (Figure 5). In addition to the massive disturbance east of Ngop and
Boaw, the Landsat change analysis showed large scale increased farming intensity
in and around major towns of Bentiu, Koch, and Leer. According to ground reports
(HRW 2015; UNHRC 2016), these areas have received high amount of displaced
people as well as cattle in 2015. This means a higher natural resource preasure
that is both difficult to observe or derive from VHR imagery. UNOSAT (2016) has
used direct observation of cattles to assess peoples whereabouts, however, this only
represents a snapshot of a dynamic situation. On the other hand, the Landsat
application
captures the footprint of the farming activity in terms intensity of the natural
resource utilization.
Therefore, Landsat data can be a
better choice for capturing piosphere or anthropogenic activity than the use of
VHR imagery. This has analogy to evaluation of burnt areas where interpretation
of Landsat data can be a better choice than VHR imagery (Sparks et al. 2015).
Overall, these results suggest that Landsat data not only can be an effective
supplement to VHR imagery but a more effective choice to produce regional
overviews that allow evaluation down to the settlement level. However, it can
also retrieve essential information that is not captured or cannot be
interpreted by using VHR imagery. This includes natural resource utilisation and
has direct relevance for sustainable development as well as understanding
and monitoring earth science systems .
Producing a similar MaxEnt
standardized difference image for the 1999–2002 data (see Figure 3 (a)) uncovers a
massive change in farming activity that closely collaborated
Prins earlier work
and ground reports (e.g., HRW 2003; de Guzman 2002 - see also hand drawn map
herein; Christian Aid 2002) of massive human abuses that eventually depopulated the Nhialdiu area in February 2002. Inserted in Figure 3 (a) are also attacked
villages and refugee campsites that were geo-located from the reports.
Furthermore, in transparent, the extent of the 2002 attack interpreted from
reports and hand drawn maps (de Guzman 2002; Christian Aid 2002) that were
reported to be depopulated in 2002. This could again be shown by the MaxEnt
change detection product (e.g., SD < −2.5
or pct. change in prediction) that inferred the decrease in farming
activity for the entire area. Again, using Google Open Street maps
un-comprehensive housing structure assessment from approximately 2013 (HOT
2016) that covered approximately two-thirds of the area and 14.450 housing
structures. This suggest that numbers of approximately 100,000 people have
been driven off their land for that area. Most people found refuge in the south
(in green) that Christian Aid (2002) have assessed to receive approximately
50,000 people by late 2002. Inserted in Figure 3 (a) is a zoom up along the
all-weather road from where specific villages have been reported attacked and
show no longer farming activities in 2002. It
should be noted that most villages were reported attacked around 1999 or before
but stayed there untill 2000.
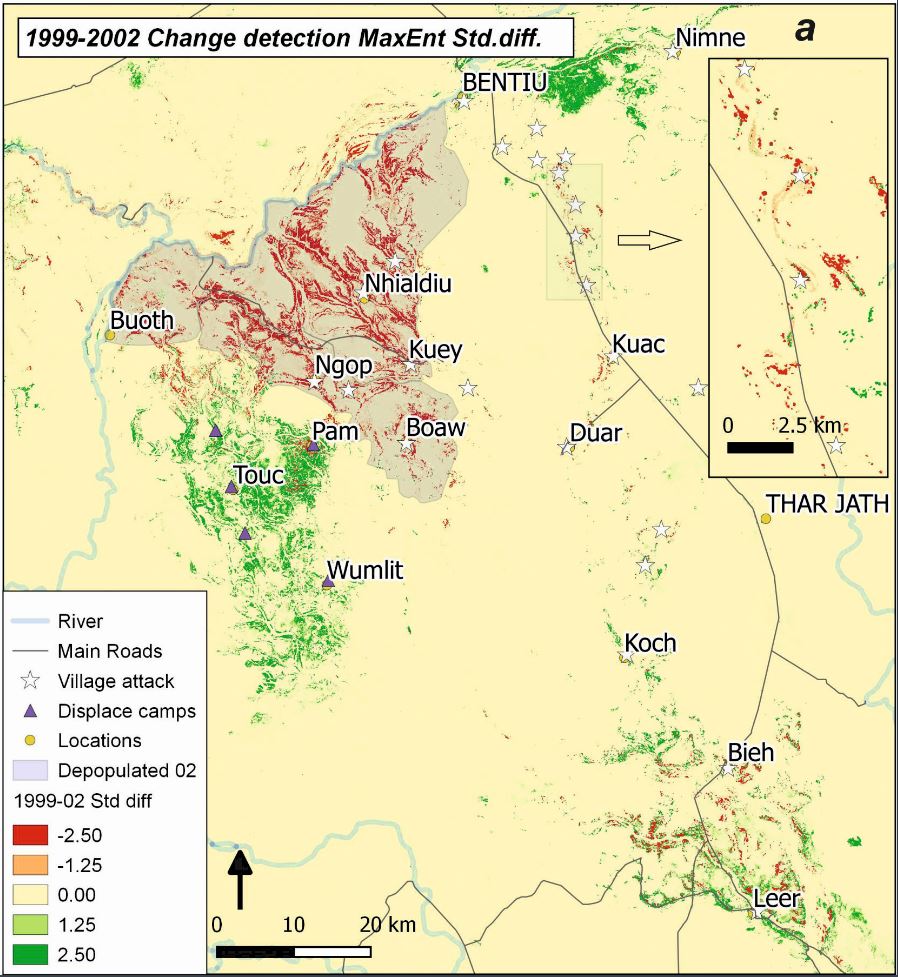
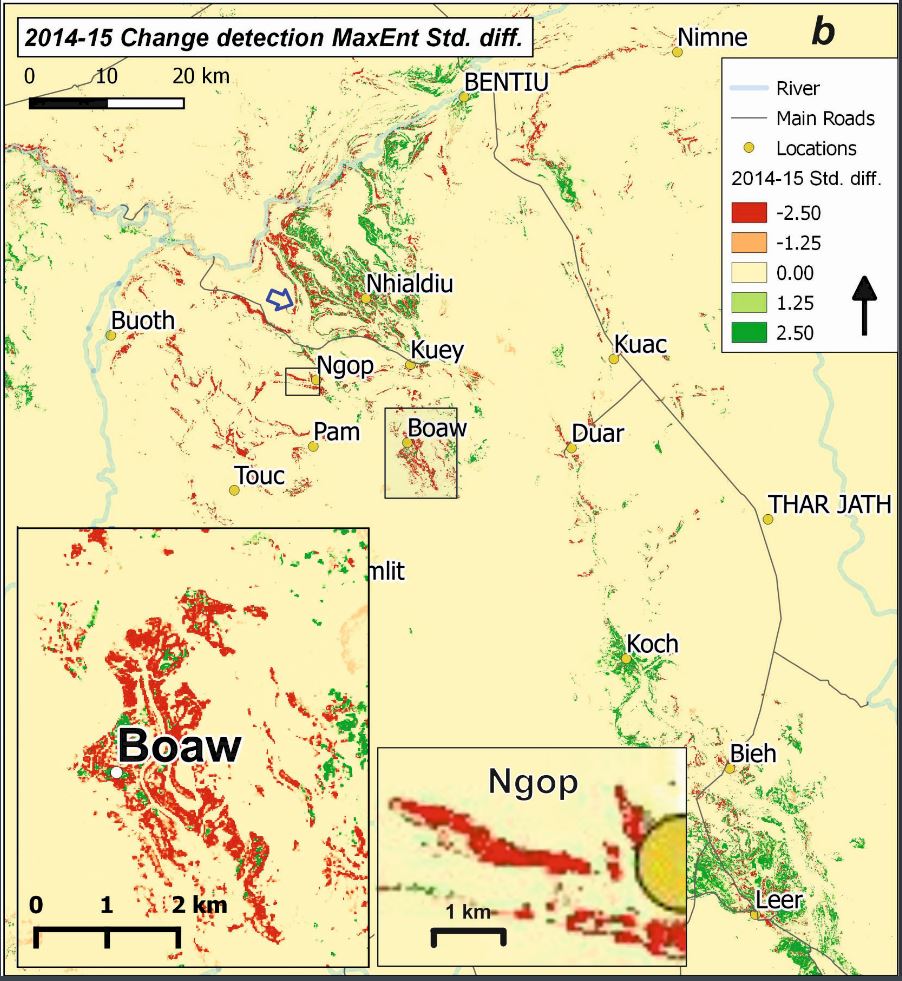

Figure 3. Change detection (z-scores) of MaxEnt derived farming activity on a large
scale (from Prins 2018), its detail and collaborate reports of massive
displacement of people from two different periods and events (1999–2002 (a) and
2014–2014 (b)).
An alternative
version showing pct (%) change in MaxEnt preciction of 1999 compared to 2002 is
also shown. Figure (b) Close up of Boaw that was completely destroyed in
2014 - small green areas are heavily degraded areas that has not recovered. The
Landsat version of Ngop can be compared with the Unosat approach (fig 4) - the Landsat showed more than Unosat approach that in-fact hide more settlement in SE
corner -
this can be viewed in GE pro. Remake the blue arrow (in b), which refers to
the location of figure
4. In
addition, remarke the green
displacement areas that collaborate that after comprehensive looting people fled
up to Nhialdiu area as well as the footprint at Koch and Leer Area that also was
a big hub for
looted cattles
going south.
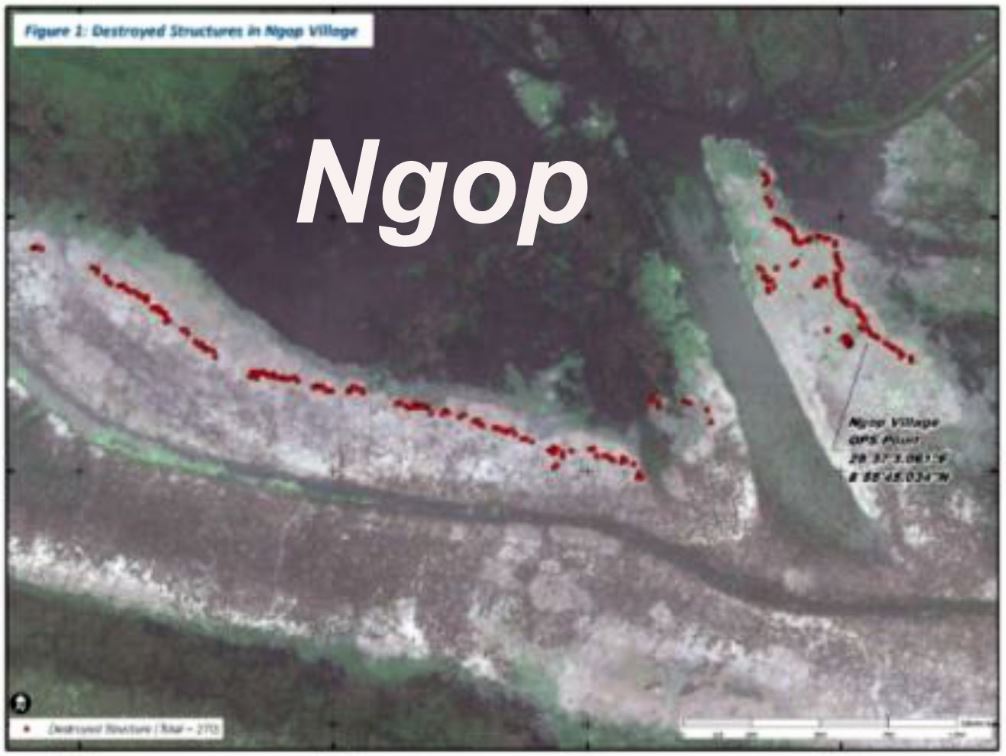
Figure
4
Clip of farming change in the Ngop village area 2014-2015
(see fig 3b).
HR image used by UNOSAT 2015
counting 250 destroyed structures – see more https://unosat-maps.web.cern.ch/SS/CE20131218SSD/Ngop_UNOSAT_20150518.pdf
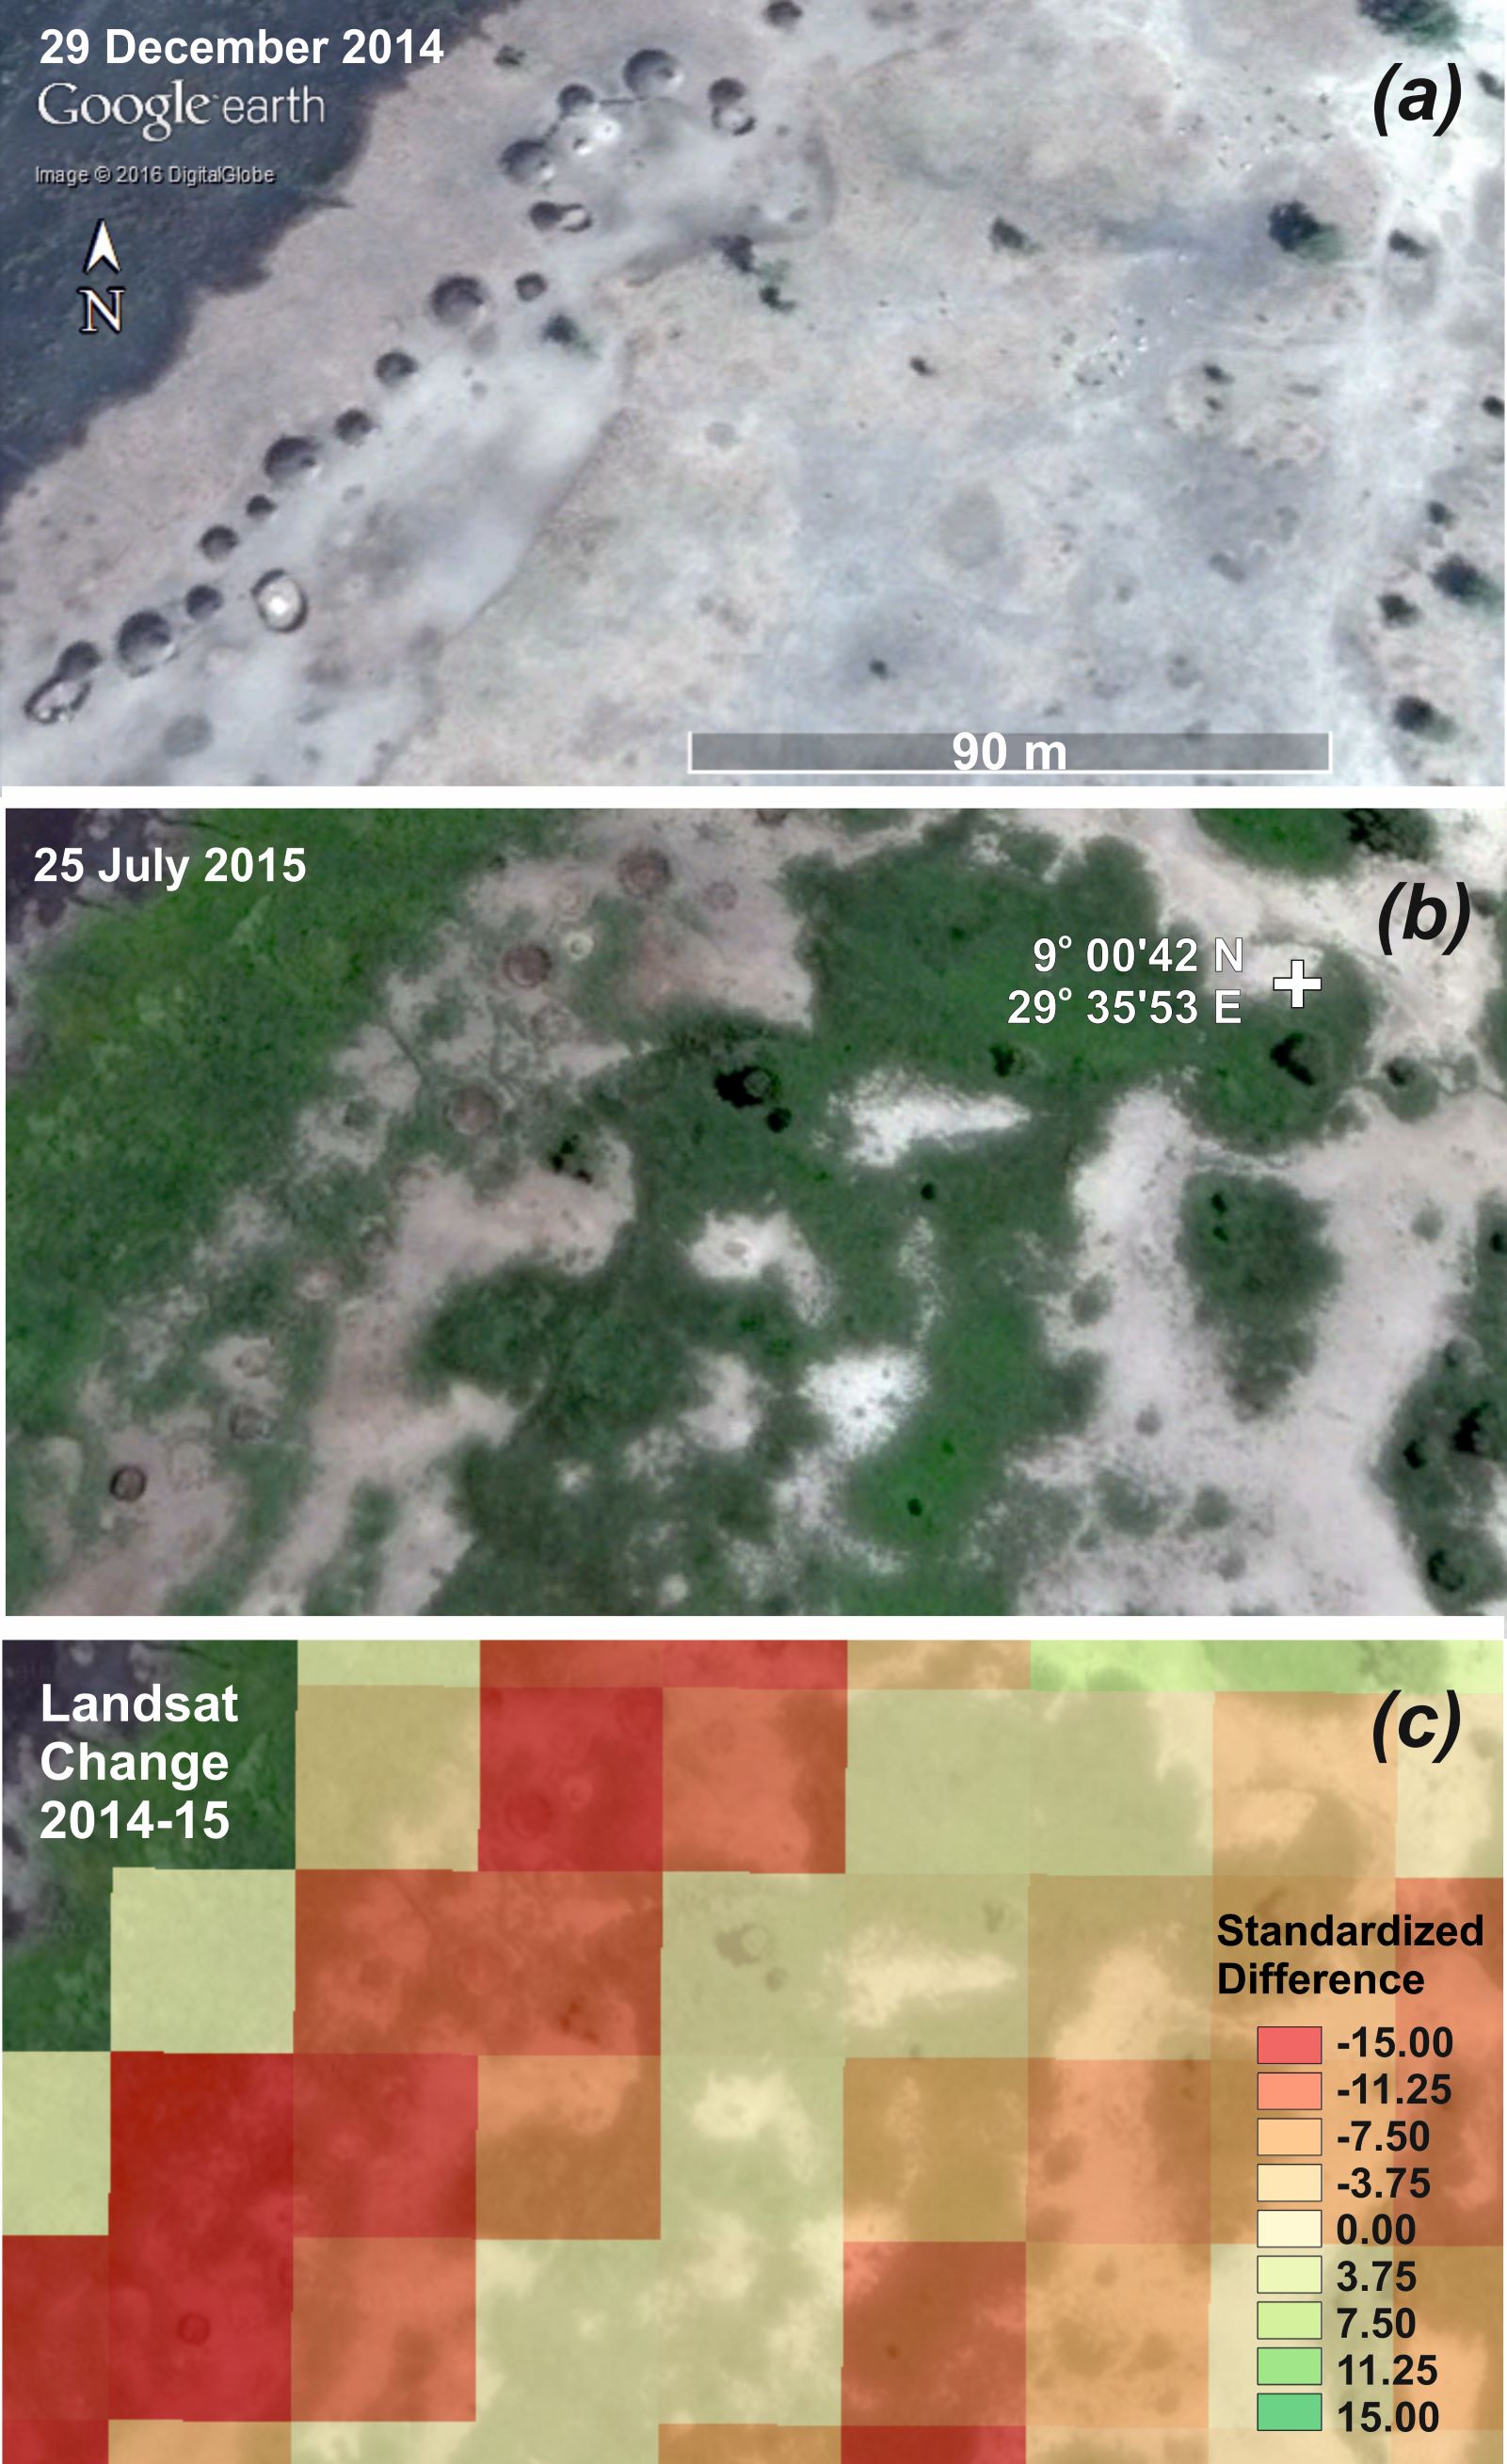
Figure
5. A typical settlement area recorded by VHR imagery in late 2014 (a), cattle’s,
most white, can be seen in upper right part of the image. The same area recorded
7 months later into the wet season. The settlement was destroyed and is rapidly
being overgrown (b). The Landsat 2014–15 difference image (z-scores) of farming
activity from MaxEnt shows a strong response to the change at settlement level.
Photo credit (Google Earth).
Figure 6. Change detection of farming activity after harvest in 1999 and 2002.
Based upon ISO classification of calibrated Landsat data (Prins 2018
and avaliable below) recorded
the 27. Nov. 1999 and 3. Nov. 2002.
The ISO classification was performed with
standard setting in Erdas Imagine - like the Prins 2009 report. The categorical
classifier immediately grabs more of the homestead surroundings than using the
supervised approach with a 10% minimum threshold. This
means
that it
captures farming activity well below the 10% threshold set out in the VHR
verification. In other words, the ISO classifier grabs the effect of farming
activity that are difficult to account for in VHR images interpretations. This
sensitivity is a plausible explanation for why
this classifyer
has for decades been considered as a stronger classifier than supervised
classification to trace the effect of pastoral farming systems.
As such, is a simple and transparant ML algorithm that can be strong to class
land covers that appears complex to threshold on the ground or by supervised
classifyers. This strainght are also known when it comes to untangle functional
forest covers - see also e.g., biodiversity session in ESA Living Planet
Symposium 2025.
Concluding
remarks on the Landsat application
VHR imagery has a clear
advantage over Landsat data of being able to check up the status of individual
building structures at any time of the year if the cloud cover permits it.
However, Landsat / Sentinel 2 data offer a huge potential for swift assessment
of humanitarian crises and derive information that can not be directly
interpreted from of VHR imagery. A large part of this potential can be reached
by understanding earth system processes which is far from being realised.
It can not be emphasised enough - to unfold the potential - you need a good
understanding of both human and natural ecology or the earth system.
The result of using
inter-calibration and continuous data has further prospect for monitoring heavy
resource utilization that is essential for understanding sustainable resources
utilization. This refers to ecosystem degradation processes that can have
traumatic consequences if the resilience is broken (Holling 1973). This is
another thematic area that have been far to little touch upon.
The spatial and multi-spectral properties of
Landsat data were able to traced farming activity beyond what could be clearly
interpreted from VHR imagery. For example, this can explain the commission errors (show too
much) by the ISODATA classification that appeared to
be rooted in farming activity below the 10% farming activity threshold used in
this work.
The work unfolded the highly effective MaxEnt algorithm
on the great potential of Landsat data. This out-perform all other tested
commonly known EO classification approaches or algorithms. For example, this
resulted in uncovering and detailed
a human tragedy covering the area in 2014-15 - that appears to have missed the
attention of media and international community and thus to take
appropriate measures. This is what EO is good at - to shed light on humanitarian
crises - however, it is the responsibility of those big organisations that take
on the EO application to show it.
If the result of the 2014-15
case is carefully interpreted
together with ground reports, the
spatial pattern (e.g. figure 23 b) tells a story which reveals what actually have happened
and the extent of it. In other words, the scale of this result provides
justice evidence and political power that interpretation of the Ngop
case will never have.
Supplements:
PRINS KEY-NOTE SPEAKER AT THE SWEDISH SPACE DAYS 2013:
Global reporting interpretation of
speech
pdf PRESENTAION OF THE 5A CASE AND ANALYSIS - INVITED TALK REMOTE SENSING DAYS
STOCKHOLM 8 APRIL 2013
pdf REPORT TO ECOS 2009:
Satellite mapping of land cover and use in relation to Oil exploitation in
concession 5A
Additional Expert Opinion
 doc List of village attacks with references
Calibrated Landsat bands produced for and used in the Prins
2018 publication and analysis (files are in ASC format).

References:
Aljazeera.
2015. Accessed 26 September 2016. http://www.aljazeera.com/indepth/features/2015/
05/south-sudan-man-catastrophe-150525120843494.html
Bastin, G.
N., G. Pickup, V. H. Chewings, and G. Pearce. 1993. “Land Degradation Assessment
in Central Australia Using a Grazing Gradient Method.”
The Rangeland Journal 15 (2): 190–216. doi:10.1071/RJ9930190.
Booth, D.T.,
and P.T. Tueller. 2003. Rangeland monitoring using remote sensing. Arid Land
Research and Management 17 (4): 455–467.
Christian
Aid. 2002. Hiding between the Streams: The War on Civilians in the Oil Region of
Southern Sudan.
http://www.christian-aid.org.uk/indepth/0205suda/sudanrpt.pdf
de Guzman, D., 2002.
Depopulating Sudan’s Oil Regions. European Coalition on Oil
in Sudan (ECOS).
http://www.ecosonline.org/back/pdf_reports/2002/depopulating%20sudans%20oil%20regions.pdf
Fagan,
Matthew, and Ruth DeFries. "Measurement and monitoring of the world’s forests: A
review and summary of remote sensing technical capability, 2009–2015." UMBC
Geography and Environmental Systems Department Collection (2009).
Google Open
Street Maps. 2015. “The Humanitarian Openstreetmap Team.” https://www.hotosm.
Org
Holling, C.
S. 1973. Resilience and stability of ecological systems. Annual Review of
Ecology and Systematics 4:1-23
HOT. 2016.
Project - South Sudan, Unity State, Bentiu. The Humanitarian OpenStreetMap Team.
http:// tasks.hotosm.org/project/396
HRW. 2003.
“Human Rights Watch (November 2003). Sudan, Oil and Human Rights. 754 p.
Accessed 26 September 2016.
http://www.hrw.org/reports/2003/sudan1103/9.htm#_ftn88#_ftn88
HRW. 2015.
“’They Burned It All’ Destruction of Villages, Killings, and Sexual Violence in
Unity State, South Sudan: Report.” 42 p. Accessed 26 September 2016. https://www.hrw.org/sites/default/
files/report_pdf/southsudan0715_web_0.pdf
James, C.
D., J. Landsberg, and S. R. Morton. 1999. “Provision of Watering Points in the
Australian Arid Zone: A Review of Effects on Biota.”
Journal of Arid Environments 41 (1): 87–121. doi:10.1006/jare.1998.0467.
Lemenkova,
Polina. "ISO Cluster classifier by ArcGIS for unsupervised classification of the
Landsat TM image of Reykjavík." Bulletin of Natural Sciences Research 11.1
(2021): 29-37.
Maynard, C.
L., R. L. Lawrence, G. A. Nielsen, and G. Decker. 2007a. “Ecological Site
Descriptions and Remotely Sensed Imagery as a Tool for Rangeland Evaluation.”
Canadian Journal of Remote Sensing 33 (2): 109–115. doi:10.5589/m07-014.
Maynard, C.
L., R. L. Lawrence, G. A. Nielsen, and G. Decker. 2007b. “Modeling Vegetation
Amount Using Bandwise Regression and Ecological Site Descriptions as an
Alternative to Vegetation Indices.” GIScience & Remote
Sensing 44 (1): 68–81. doi:10.2747/1548-1603.44.1.68.
Olofsson,
P., G. M. Foody, M. Herold, S. V. Stehman, C. E. Woodcock, and M. A. Wulder.
2014. “Good Practices for Estimating Area and Assessing Accuracy of Land
Change.” Remote Sensing of Environment 148: 42–57. doi:
10.1016/j.rse.2014.02.015.
Phillips, S.
J., R. P. Anderson, and R. E. Schapire. 2006. “Maximum Entropy Modeling of
Species Geographic Distributions.” Ecological
Modelling 190 (3): 231–259. doi:10.1016/j. ecolmodel.2005.03.026.
Pontius, R.
G. Jr, and M. Millones. 2011. “Death to Kappa: Birth of Quantity Disagreement
and Allocation Disagreement for Accuracy Assessment.”
International Journal of Remote Sensing 32 (15): 4407–4429.
doi:10.1080/01431161.2011.552923
Erik Prins (2018) Landsat
approaches to map agro-pastoral farming in the wetlands of southern
Sudan, International Journal of Remote Sensing, 39:3, 854-878, DOI: 10.1080/01431161.2017.1392634
Samain, O.,
L. Kergoat, P. Hiernaux, F. Guichard, E. Mougin, F. Timouk, and F. Lavenu. 2008.
“Analysis of the in Situ and MODIS Albedo Variability at Multiple Timescales in
the Sahel.” Journal of Geophysical Research:
Atmospheres 113: D14. doi:10.1029/2007JD009174
Stehman, S.
V. 2004. “A Critical Evaluation of the Normalized Error Matrix in Map Accuracy
Assessment.” Photogrammetric Engineering & Remote Sensing 70 (6): 743–751.
doi:10.14358/ PERS.70.6.743
Tueller, P.
T. 1989. “Technology for Rangeland Management.” Invited Synthesis Paper 42 (6):
442.
UNHRC. 2016.
“UN Human Rights Council.” Assessment mission by the Office of the United ations
High Commissioner for Human Rights to improve human rights, accountability,
reconciliation and capacity in South Sudan: detailed findings, 10 March 2016, A/HRC/31/CRP.6.
Accessed 26 April 2016.
http://www.refworld.org/docid/56e2ee954.html
UNMISS 2015:
UN Mission to South Sudan. 2015. “2015, Flash Human Rights Report on the
Escalation of Fighting in Greater Upper Nile.” April/May, June 29. Accessed 26
April 2016.
http://www.refworld.org/docid/5592995c4.html
Unosat.
2016. “UNOSAT LIVE Map for South Sudan Complex Emergency (CE20131218SSD).”
Accessed 26 September 2016.
https://unosat.maps.arcgis.com/apps/webappviewer/index.html
id=cac78381476c43ebb98a7e642211809d
UNOSAT.
2015. “Rapid Damage Assessment of the Area of Rapid Damage Assessment of the
Area of Ngop Ngop, Unity State, South Sudan.” Accessed 26 September 2016.
http://unosat-maps. web.cern.ch/unosat-maps/SS/CE20131218SSD/Ngop_UNOSAT_20150518.pdf
Washington-Allen, R. A., N. E. West, R. Douglas Ramsey, and R. A. Efroymson.
2006. “A Protocol for Retrospective Remote Sensing–Based Ecological Monitoring
of Rangelands.” Rangeland Ecology & Management 59 (1): 19–29.
doi:10.2111/04-116R2.1.
privacy@prins engineering.com
About Us |
References
|
Services |
CV's |
Contacts |
Press
Copyright © PRINS, Eng. 2025